
|
JACCS Co., Ltd. (8584.t) Valoración de DCF |
Completamente Editable: Adáptelo A Sus Necesidades En Excel O Sheets
Diseño Profesional: Plantillas Confiables Y Estándares De La Industria
Predeterminadas Para Un Uso Rápido Y Eficiente
Compatible con MAC / PC, completamente desbloqueado
No Se Necesita Experiencia; Fáciles De Seguir
JACCS Co., Ltd. (8584.T) Bundle
¡Descubra el verdadero potencial de JACCS Co., Ltd. (8584t) con nuestra calculadora DCF avanzada! Ajuste los supuestos clave, explore varios escenarios y evalúe los efectos de los cambios en JACCS Co., Ltd. (8584T) Valoración, todo dentro de una plantilla de Excel fácil de usar.
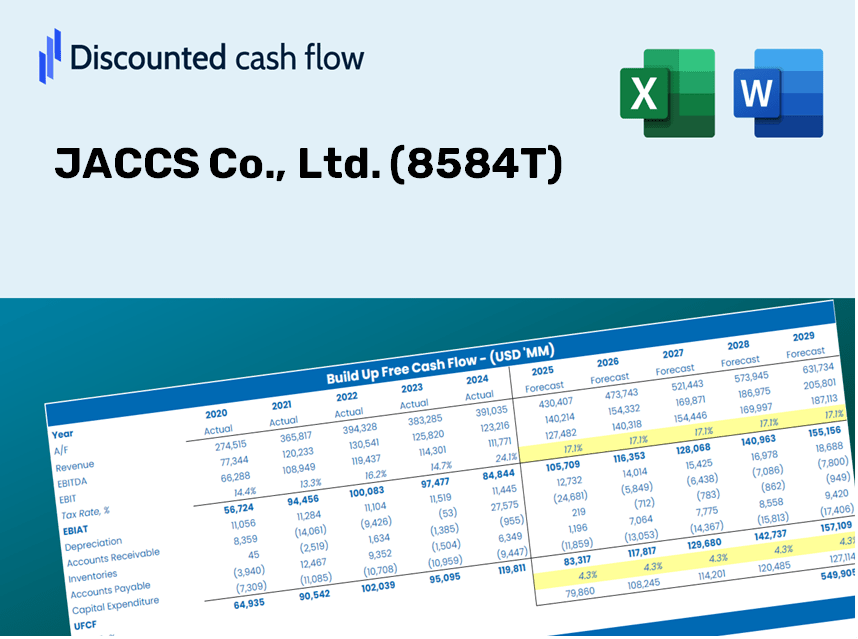
Discounted Cash Flow (DCF) - (USD MM)
| Year | AY1 2020 |
AY2 2021 |
AY3 2022 |
AY4 2023 |
AY5 2024 |
FY1 2025 |
FY2 2026 |
FY3 2027 |
FY4 2028 |
FY5 2029 |
|---|---|---|---|---|---|---|---|---|---|---|
| Revenue | 160,647.0 | 164,069.0 | 173,505.0 | 184,780.0 | 190,976.0 | 199,442.4 | 208,284.1 | 217,517.9 | 227,160.9 | 237,231.5 |
| Revenue Growth, % | 0 | 2.13 | 5.75 | 6.5 | 3.35 | 4.43 | 4.43 | 4.43 | 4.43 | 4.43 |
| EBITDA | 26,277.0 | 37,379.0 | 42,096.0 | 44,588.0 | 60,699.0 | 47,593.1 | 49,703.0 | 51,906.5 | 54,207.6 | 56,610.8 |
| EBITDA, % | 16.36 | 22.78 | 24.26 | 24.13 | 31.78 | 23.86 | 23.86 | 23.86 | 23.86 | 23.86 |
| Depreciation | 9,951.0 | 10,635.0 | 10,417.0 | 11,461.0 | 11,220.0 | 12,268.8 | 12,812.7 | 13,380.7 | 13,973.9 | 14,593.4 |
| Depreciation, % | 6.19 | 6.48 | 6 | 6.2 | 5.88 | 6.15 | 6.15 | 6.15 | 6.15 | 6.15 |
| EBIT | 16,326.0 | 26,744.0 | 31,679.0 | 33,127.0 | 49,479.0 | 35,324.3 | 36,890.3 | 38,525.8 | 40,233.7 | 42,017.3 |
| EBIT, % | 10.16 | 16.3 | 18.26 | 17.93 | 25.91 | 17.71 | 17.71 | 17.71 | 17.71 | 17.71 |
| Total Cash | 112,241.0 | 138,790.0 | 162,351.0 | 187,611.0 | 174,712.0 | 175,316.1 | 183,088.3 | 191,205.0 | 199,681.6 | 208,533.9 |
| Total Cash, percent | .0 | .0 | .0 | .0 | .0 | .0 | .0 | .0 | .0 | .0 |
| Account Receivables | 4,200,378.0 | 4,506,529.0 | 3,242,963.0 | 3,388,425.0 | 3,419,845.0 | 199,442.4 | 208,284.1 | 217,517.9 | 227,160.9 | 237,231.5 |
| Account Receivables, % | 2614.66 | 2746.73 | 1869.09 | 1833.76 | 1790.72 | 100 | 100 | 100 | 100 | 100 |
| Inventories | .0 | -61,935.0 | -71,071.0 | .0 | .0 | -31,396.7 | -32,788.6 | -34,242.2 | -35,760.3 | -37,345.6 |
| Inventories, % | 0 | -37.75 | -40.96 | 0 | 0 | -15.74 | -15.74 | -15.74 | -15.74 | -15.74 |
| Accounts Payable | 1,699,281.0 | 1,814,415.0 | 254,341.0 | 268,581.0 | 221,268.0 | 199,442.4 | 208,284.1 | 217,517.9 | 227,160.9 | 237,231.5 |
| Accounts Payable, % | 1057.77 | 1105.89 | 146.59 | 145.35 | 115.86 | 100 | 100 | 100 | 100 | 100 |
| Capital Expenditure | -9,597.0 | -8,163.0 | -9,551.0 | -8,669.0 | -9,015.0 | -10,317.6 | -10,775.0 | -11,252.7 | -11,751.5 | -12,272.5 |
| Capital Expenditure, % | -5.97 | -4.98 | -5.5 | -4.69 | -4.72 | -5.17 | -5.17 | -5.17 | -5.17 | -5.17 |
| Tax Rate, % | 29.62 | 29.62 | 29.62 | 29.62 | 29.62 | 29.62 | 29.62 | 29.62 | 29.62 | 29.62 |
| EBITAT | 11,814.9 | 18,240.3 | 21,397.7 | 22,901.0 | 34,825.1 | 24,559.7 | 25,648.5 | 26,785.6 | 27,973.0 | 29,213.1 |
| Depreciation | ||||||||||
| Changes in Account Receivables | ||||||||||
| Changes in Inventories | ||||||||||
| Changes in Accounts Payable | ||||||||||
| Capital Expenditure | ||||||||||
| UFCF | -2,488,928.1 | -108,369.7 | -265,108.3 | -176,600.0 | -41,702.9 | 3,256,484.7 | 29,078.1 | 30,367.3 | 31,713.5 | 33,119.4 |
| WACC, % | 2.77 | 2.63 | 2.6 | 2.66 | 2.7 | 2.67 | 2.67 | 2.67 | 2.67 | 2.67 |
| PV UFCF | ||||||||||
| SUM PV UFCF | 3,284,881.2 | |||||||||
| Long Term Growth Rate, % | 2.00 | |||||||||
| Free cash flow (T + 1) | 33,782 | |||||||||
| Terminal Value | 5,013,376 | |||||||||
| Present Terminal Value | 4,393,710 | |||||||||
| Enterprise Value | 7,678,591 | |||||||||
| Net Debt | 2,771,544 | |||||||||
| Equity Value | 4,907,047 | |||||||||
| Diluted Shares Outstanding, MM | 35 | |||||||||
| Equity Value Per Share | 140,962.54 |
Benefits of Our Offering
- Adjustable Forecast Inputs: Effortlessly modify assumptions (growth %, margins, WACC) to explore various scenarios.
- Comprehensive Data: Pre-loaded financial data for JACCS Co., Ltd. (8584T) to kickstart your analysis.
- Automated DCF Results: The template automatically computes Net Present Value (NPV) and intrinsic value for you.
- Tailorable and Professional: A sophisticated Excel model that aligns with your valuation requirements.
- Designed for Analysts and Investors: Perfect for evaluating projections, confirming strategies, and enhancing efficiency.
Key Features
- Comprehensive JACCS Data: Pre-loaded with JACCS Co., Ltd.'s historical financial information and future projections.
- Fully Adjustable Parameters: Customize inputs such as revenue growth, profit margins, WACC, tax rates, and capital expenditures.
- Interactive Valuation Model: Real-time updates to Net Present Value (NPV) and intrinsic value based on user-defined inputs.
- Scenario Analysis: Develop multiple forecasting scenarios to evaluate various valuation results.
- Intuitive User Interface: Designed to be straightforward and accessible for both professionals and novices.
How It Works
- Step 1: Download the prebuilt Excel template containing JACCS Co., Ltd.'s (8584T) data.
- Step 2: Review the pre-filled sheets to familiarize yourself with the key metrics.
- Step 3: Adjust forecasts and assumptions in the editable yellow cells (WACC, growth, margins).
- Step 4: View the updated results instantly, including JACCS Co., Ltd.'s (8584T) intrinsic value.
- Step 5: Utilize the outputs to make informed investment decisions or create comprehensive reports.
Why Choose This Calculator from JACCS Co., Ltd. (8584T)?
- All-in-One Solution: Combines DCF, WACC, and financial ratio analyses seamlessly.
- Flexible Inputs: Modify the highlighted cells to explore different scenarios.
- In-Depth Analysis: Automatically computes JACCS's intrinsic value and Net Present Value.
- Preloaded Information: Access historical and projected data for precise calculations.
- Expert-Level Resource: Perfect for financial analysts, investors, and business advisors.
Who Is This Product For?
- Individual Investors: Make informed choices regarding investments in JACCS Co., Ltd. (8584T).
- Financial Analysts: Improve valuation efficiency with pre-built financial models tailored for JACCS Co., Ltd. (8584T).
- Consultants: Provide clients with accurate and timely valuation insights related to JACCS Co., Ltd. (8584T).
- Business Owners: Gain insights into how companies like JACCS Co., Ltd. (8584T) are valued to inform your own business strategy.
- Finance Students: Acquire practical valuation skills using real-life data and case studies involving JACCS Co., Ltd. (8584T).
Contents of the Template
- Pre-Filled DCF Model: JACCS Co., Ltd. (8584T) financial data preloaded for immediate application.
- WACC Calculator: Comprehensive calculations for the Weighted Average Cost of Capital.
- Financial Ratios: Assess JACCS Co., Ltd. (8584T) profitability, leverage, and efficiency metrics.
- Editable Inputs: Modify assumptions such as growth rates, margins, and capital expenditures to suit your scenarios.
- Financial Statements: Access annual and quarterly reports for in-depth analysis.
- Interactive Dashboard: Effortlessly visualize key valuation metrics and outcomes.
Disclaimer
All information, articles, and product details provided on this website are for general informational and educational purposes only. We do not claim any ownership over, nor do we intend to infringe upon, any trademarks, copyrights, logos, brand names, or other intellectual property mentioned or depicted on this site. Such intellectual property remains the property of its respective owners, and any references here are made solely for identification or informational purposes, without implying any affiliation, endorsement, or partnership.
We make no representations or warranties, express or implied, regarding the accuracy, completeness, or suitability of any content or products presented. Nothing on this website should be construed as legal, tax, investment, financial, medical, or other professional advice. In addition, no part of this site—including articles or product references—constitutes a solicitation, recommendation, endorsement, advertisement, or offer to buy or sell any securities, franchises, or other financial instruments, particularly in jurisdictions where such activity would be unlawful.
All content is of a general nature and may not address the specific circumstances of any individual or entity. It is not a substitute for professional advice or services. Any actions you take based on the information provided here are strictly at your own risk. You accept full responsibility for any decisions or outcomes arising from your use of this website and agree to release us from any liability in connection with your use of, or reliance upon, the content or products found herein.