
|
MS & Ad Insurance Group Holdings, Inc. (8725.T) Valoración de DCF |
Completamente Editable: Adáptelo A Sus Necesidades En Excel O Sheets
Diseño Profesional: Plantillas Confiables Y Estándares De La Industria
Predeterminadas Para Un Uso Rápido Y Eficiente
Compatible con MAC / PC, completamente desbloqueado
No Se Necesita Experiencia; Fáciles De Seguir
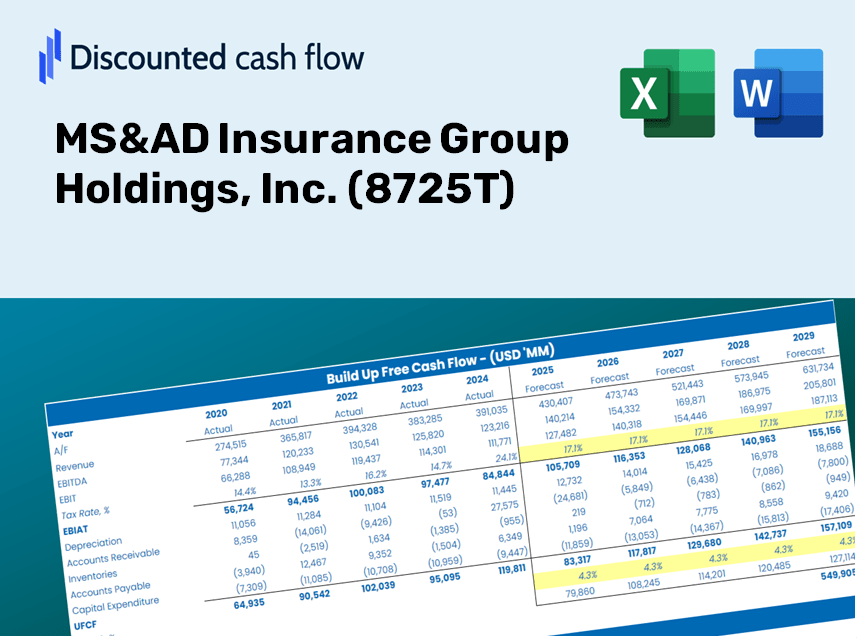
MS&AD Insurance Group Holdings, Inc. (8725.T) Bundle
¡Evalúe las perspectivas financieras de MS & Ad Insurance Group Holdings, Inc. (8725T) como un experto! Esta calculadora DCF (8725T) proporciona datos financieros previamente llenos y la flexibilidad para modificar el crecimiento de los ingresos, WACC, los márgenes y otros supuestos cruciales para alinearse con sus pronósticos.
Discounted Cash Flow (DCF) - (USD MM)
| Year | AY1 2021 |
AY2 2022 |
AY3 2023 |
AY4 2024 |
AY5 2025 |
FY1 2026 |
FY2 2027 |
FY3 2028 |
FY4 2029 |
FY5 2030 |
|---|---|---|---|---|---|---|---|---|---|---|
| Revenue | 4,885,330.0 | 5,119,604.0 | 5,225,552.0 | 6,559,215.0 | 6,435,185.0 | 6,925,802.6 | 7,453,824.8 | 8,022,103.3 | 8,633,707.3 | 9,291,940.0 |
| Revenue Growth, % | 0 | 4.8 | 2.07 | 25.52 | -1.89 | 7.62 | 7.62 | 7.62 | 7.62 | 7.62 |
| EBITDA | 216,336.0 | 385,514.0 | 306,999.0 | 472,724.0 | 919,165.0 | 544,698.3 | 586,226.0 | 630,919.8 | 679,021.0 | 730,789.5 |
| EBITDA, % | 4.43 | 7.53 | 5.87 | 7.21 | 14.28 | 7.86 | 7.86 | 7.86 | 7.86 | 7.86 |
| Depreciation | .0 | .0 | .0 | .0 | .0 | .0 | .0 | .0 | .0 | .0 |
| Depreciation, % | 0 | 0 | 0 | 0 | 0 | 0 | 0 | 0 | 0 | 0 |
| EBIT | 216,336.0 | 385,514.0 | 306,999.0 | 472,724.0 | 919,165.0 | 544,698.3 | 586,226.0 | 630,919.8 | 679,021.0 | 730,789.5 |
| EBIT, % | 4.43 | 7.53 | 5.87 | 7.21 | 14.28 | 7.86 | 7.86 | 7.86 | 7.86 | 7.86 |
| Total Cash | 2,057,789.0 | 2,357,036.0 | 2,771,981.0 | 2,911,347.0 | 2,139,796.0 | 3,031,354.4 | 3,262,464.5 | 3,511,194.3 | 3,778,887.3 | 4,066,989.1 |
| Total Cash, percent | .0 | .0 | .0 | .0 | .0 | .0 | .0 | .0 | .0 | .0 |
| Account Receivables | .0 | .0 | .0 | .0 | .0 | .0 | .0 | .0 | .0 | .0 |
| Account Receivables, % | 0 | 0 | 0 | 0 | 0 | 0 | 0 | 0 | 0 | 0 |
| Inventories | .0 | .0 | .0 | .0 | .0 | .0 | .0 | .0 | .0 | .0 |
| Inventories, % | 0 | 0 | 0 | 0 | 0 | 0 | 0 | 0 | 0 | 0 |
| Accounts Payable | .0 | .0 | .0 | .0 | .0 | .0 | .0 | .0 | .0 | .0 |
| Accounts Payable, % | 0 | 0 | 0 | 0 | 0 | 0 | 0 | 0 | 0 | 0 |
| Capital Expenditure | -33,696.0 | -28,130.0 | -24,625.0 | -22,877.0 | -25,199.0 | -33,947.4 | -36,535.6 | -39,321.1 | -42,318.9 | -45,545.3 |
| Capital Expenditure, % | -0.68974 | -0.54946 | -0.47124 | -0.34878 | -0.39158 | -0.49016 | -0.49016 | -0.49016 | -0.49016 | -0.49016 |
| Tax Rate, % | 23.77 | 23.77 | 23.77 | 23.77 | 23.77 | 23.77 | 23.77 | 23.77 | 23.77 | 23.77 |
| EBITAT | 154,856.0 | 273,798.9 | 210,611.6 | 377,623.3 | 700,638.7 | 400,151.0 | 430,658.4 | 463,491.7 | 498,828.3 | 536,858.9 |
| Depreciation | ||||||||||
| Changes in Account Receivables | ||||||||||
| Changes in Inventories | ||||||||||
| Changes in Accounts Payable | ||||||||||
| Capital Expenditure | ||||||||||
| UFCF | 121,160.0 | 245,668.9 | 185,986.6 | 354,746.3 | 675,439.7 | 366,203.5 | 394,122.8 | 424,170.7 | 456,509.4 | 491,313.6 |
| WACC, % | 4.34 | 4.34 | 4.33 | 4.37 | 4.36 | 4.35 | 4.35 | 4.35 | 4.35 | 4.35 |
| PV UFCF | ||||||||||
| SUM PV UFCF | 1,868,392.2 | |||||||||
| Long Term Growth Rate, % | 2.00 | |||||||||
| Free cash flow (T + 1) | 501,140 | |||||||||
| Terminal Value | 21,339,606 | |||||||||
| Present Terminal Value | 17,248,740 | |||||||||
| Enterprise Value | 19,117,132 | |||||||||
| Net Debt | -4,212,564 | |||||||||
| Equity Value | 23,329,696 | |||||||||
| Diluted Shares Outstanding, MM | 1,553 | |||||||||
| Equity Value Per Share | 15,025.31 |
What You Will Receive
- Genuine MS&AD Data: Preloaded financial information – encompassing revenue to EBIT – based on actual and projected metrics.
- Comprehensive Customization: Modify all essential variables (yellow cells) such as WACC, growth %, and tax rates.
- Immediate Valuation Adjustments: Automatic recalculations to evaluate the effects of changes on MS&AD's fair value.
- Flexible Excel Template: Designed for quick modifications, scenario analysis, and in-depth projections.
- Efficient and Precise: Avoid the hassle of constructing models from the ground up while ensuring accuracy and adaptability.
Key Features
- Real-Life MS&AD Data: Pre-filled with MS&AD Insurance Group Holdings, Inc.'s historical financials and future projections.
- Fully Customizable Inputs: Modify parameters such as premium growth, loss ratios, discount rates, tax implications, and investment strategies.
- Dynamic Valuation Model: Automatic recalibration of Net Present Value (NPV) and intrinsic value based on your entered data.
- Scenario Testing: Develop various forecast scenarios to evaluate different valuation possibilities.
- User-Friendly Design: Intuitive and organized layout suitable for both professionals and newcomers.
How It Works
- 1. Open the Template: Download and access the Excel file containing MS&AD Insurance Group Holdings, Inc. (8725T)'s preloaded data.
- 2. Edit Assumptions: Adjust key inputs such as growth rates, WACC, and capital expenditures as needed.
- 3. View Results Instantly: The DCF model will dynamically calculate the intrinsic value and NPV based on your inputs.
- 4. Test Scenarios: Evaluate different forecasts to analyze various valuation results.
- 5. Use with Confidence: Share professional valuation insights to bolster your decision-making process.
Why Choose MS&AD Insurance Group Holdings, Inc. ([8725T])?
- Time Efficiency: Skip the complexities of creating a financial model from scratch – it’s pre-configured for you.
- Enhanced Accuracy: Access to dependable financial data and formulas minimizes valuation errors.
- Fully Customizable: Adapt the model to suit your specific assumptions and forecasts.
- Easy to Understand: Intuitive charts and outputs facilitate straightforward result analysis.
- Endorsed by Professionals: Tailored for specialists who prioritize precision and user-friendliness.
Who Can Benefit from This Product?
- Insurance Students: Master risk assessment techniques and apply them to real-world scenarios.
- Researchers: Utilize advanced models for your academic studies or publications.
- Investors: Evaluate your investment theories and analyze valuation trends for MS&AD Insurance Group Holdings, Inc. (8725T).
- Market Analysts: Optimize your analytical processes with a ready-built, customizable DCF model.
- Entrepreneurs: Discover how major public insurance companies like MS&AD are assessed and valued.
What the Template Includes
- Historical Data: Contains MS&AD Insurance Group Holdings, Inc.'s past financial performance and baseline forecasts.
- DCF and Levered DCF Models: Comprehensive templates for calculating the intrinsic value of MS&AD Insurance Group Holdings, Inc.
- WACC Sheet: Pre-formulated calculations for the Weighted Average Cost of Capital.
- Editable Inputs: Customize critical drivers such as growth rates, EBITDA margins, and CAPEX estimates.
- Quarterly and Annual Statements: A detailed analysis of MS&AD Insurance Group Holdings, Inc.'s financials.
- Interactive Dashboard: Dynamically visualize valuation outcomes and forecasts.
Disclaimer
All information, articles, and product details provided on this website are for general informational and educational purposes only. We do not claim any ownership over, nor do we intend to infringe upon, any trademarks, copyrights, logos, brand names, or other intellectual property mentioned or depicted on this site. Such intellectual property remains the property of its respective owners, and any references here are made solely for identification or informational purposes, without implying any affiliation, endorsement, or partnership.
We make no representations or warranties, express or implied, regarding the accuracy, completeness, or suitability of any content or products presented. Nothing on this website should be construed as legal, tax, investment, financial, medical, or other professional advice. In addition, no part of this site—including articles or product references—constitutes a solicitation, recommendation, endorsement, advertisement, or offer to buy or sell any securities, franchises, or other financial instruments, particularly in jurisdictions where such activity would be unlawful.
All content is of a general nature and may not address the specific circumstances of any individual or entity. It is not a substitute for professional advice or services. Any actions you take based on the information provided here are strictly at your own risk. You accept full responsibility for any decisions or outcomes arising from your use of this website and agree to release us from any liability in connection with your use of, or reliance upon, the content or products found herein.