
|
RELO GROUP, Inc. (8876.T) Valoración de DCF |
Completamente Editable: Adáptelo A Sus Necesidades En Excel O Sheets
Diseño Profesional: Plantillas Confiables Y Estándares De La Industria
Predeterminadas Para Un Uso Rápido Y Eficiente
Compatible con MAC / PC, completamente desbloqueado
No Se Necesita Experiencia; Fáciles De Seguir
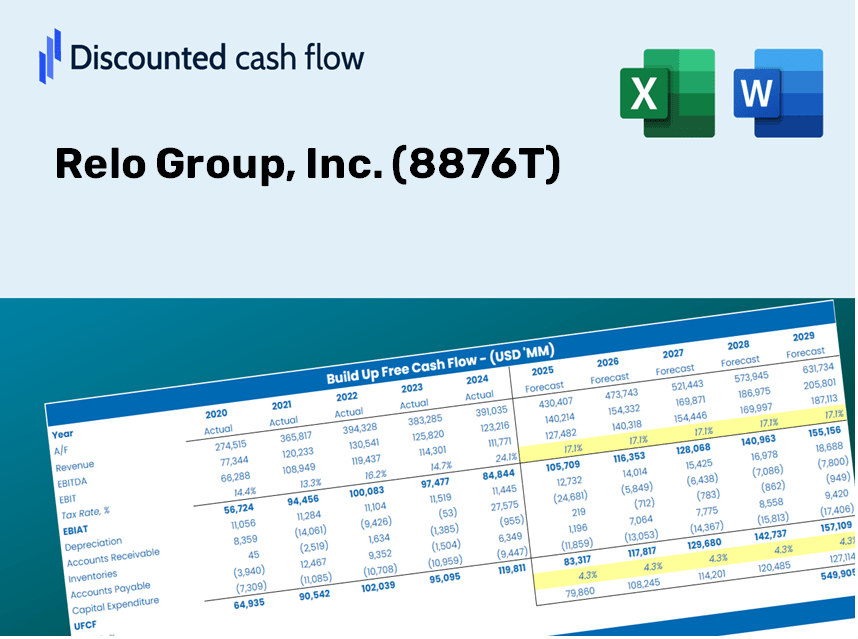
Relo Group, Inc. (8876.T) Bundle
Ingementista para su precisión, nuestra calculadora DCF [8876T] le permite evaluar la valoración RELO Group, Inc. utilizando datos financieros del mundo real, ofreciendo una flexibilidad completa para modificar todos los parámetros esenciales para mejorar las proyecciones.
Discounted Cash Flow (DCF) - (USD MM)
| Year | AY1 2020 |
AY2 2021 |
AY3 2022 |
AY4 2023 |
AY5 2024 |
FY1 2025 |
FY2 2026 |
FY3 2027 |
FY4 2028 |
FY5 2029 |
|---|---|---|---|---|---|---|---|---|---|---|
| Revenue | 333,603.0 | 156,571.0 | 123,698.0 | 132,580.0 | 142,908.0 | 121,796.3 | 103,803.3 | 88,468.5 | 75,399.1 | 64,260.4 |
| Revenue Growth, % | 0 | -53.07 | -21 | 7.18 | 7.79 | -14.77 | -14.77 | -14.77 | -14.77 | -14.77 |
| EBITDA | 17,878.0 | 23,605.0 | 26,289.0 | 41,559.0 | 47,786.0 | 25,935.9 | 22,104.4 | 18,838.9 | 16,055.9 | 13,683.9 |
| EBITDA, % | 5.36 | 15.08 | 21.25 | 31.35 | 33.44 | 21.29 | 21.29 | 21.29 | 21.29 | 21.29 |
| Depreciation | 144,057.0 | 95,565.0 | 5,626.0 | 16,637.0 | 17,348.0 | 32,508.5 | 27,706.0 | 23,613.0 | 20,124.7 | 17,151.7 |
| Depreciation, % | 43.18 | 61.04 | 4.55 | 12.55 | 12.14 | 26.69 | 26.69 | 26.69 | 26.69 | 26.69 |
| EBIT | -126,179.0 | -71,960.0 | 20,663.0 | 24,922.0 | 30,438.0 | -6,572.6 | -5,601.6 | -4,774.1 | -4,068.8 | -3,467.7 |
| EBIT, % | -37.82 | -45.96 | 16.7 | 18.8 | 21.3 | -5.4 | -5.4 | -5.4 | -5.4 | -5.4 |
| Total Cash | 50,198.0 | 50,197.0 | 51,686.0 | 52,226.0 | 64,021.0 | 42,161.5 | 35,933.0 | 30,624.7 | 26,100.5 | 22,244.7 |
| Total Cash, percent | .0 | .0 | .0 | .0 | .0 | .0 | .0 | .0 | .0 | .0 |
| Account Receivables | 5,543.0 | 98,154.0 | 85,197.0 | 82,229.0 | 89,196.0 | 62,764.9 | 53,492.7 | 45,590.2 | 38,855.2 | 33,115.1 |
| Account Receivables, % | 1.66 | 62.69 | 68.88 | 62.02 | 62.41 | 51.53 | 51.53 | 51.53 | 51.53 | 51.53 |
| Inventories | 20,988.0 | 5,613.0 | 6,410.0 | 6,980.0 | .0 | 4,950.5 | 4,219.2 | 3,595.9 | 3,064.7 | 2,611.9 |
| Inventories, % | 6.29 | 3.58 | 5.18 | 5.26 | 0 | 4.06 | 4.06 | 4.06 | 4.06 | 4.06 |
| Accounts Payable | 11,601.0 | 16,779.0 | 67,849.0 | 61,382.0 | .0 | 28,096.6 | 23,945.9 | 20,408.4 | 17,393.5 | 14,823.9 |
| Accounts Payable, % | 3.48 | 10.72 | 54.85 | 46.3 | 0 | 23.07 | 23.07 | 23.07 | 23.07 | 23.07 |
| Capital Expenditure | -4,353.0 | -6,004.0 | -4,110.0 | -4,075.0 | -4,068.0 | -3,503.4 | -2,985.9 | -2,544.8 | -2,168.8 | -1,848.4 |
| Capital Expenditure, % | -1.3 | -3.83 | -3.32 | -3.07 | -2.85 | -2.88 | -2.88 | -2.88 | -2.88 | -2.88 |
| Tax Rate, % | 11.97 | 11.97 | 11.97 | 11.97 | 11.97 | 11.97 | 11.97 | 11.97 | 11.97 | 11.97 |
| EBITAT | -67,116.3 | -55,735.3 | 16,684.9 | 35,712.8 | 26,794.6 | -5,250.5 | -4,474.8 | -3,813.8 | -3,250.4 | -2,770.2 |
| Depreciation | ||||||||||
| Changes in Account Receivables | ||||||||||
| Changes in Inventories | ||||||||||
| Changes in Accounts Payable | ||||||||||
| Capital Expenditure | ||||||||||
| UFCF | 57,657.7 | -38,232.3 | 81,430.9 | 44,205.8 | -21,294.4 | 73,331.8 | 26,098.2 | 22,242.7 | 18,956.8 | 16,156.3 |
| WACC, % | 5.12 | 5.34 | 5.37 | 5.54 | 5.43 | 5.36 | 5.36 | 5.36 | 5.36 | 5.36 |
| PV UFCF | ||||||||||
| SUM PV UFCF | 139,959.3 | |||||||||
| Long Term Growth Rate, % | 1.00 | |||||||||
| Free cash flow (T + 1) | 16,318 | |||||||||
| Terminal Value | 374,327 | |||||||||
| Present Terminal Value | 288,328 | |||||||||
| Enterprise Value | 428,288 | |||||||||
| Net Debt | 23,911 | |||||||||
| Equity Value | 404,377 | |||||||||
| Diluted Shares Outstanding, MM | 159 | |||||||||
| Equity Value Per Share | 2,538.02 |
What You Will Receive
- Comprehensive Relo Group Financials: Access to historical and projected data for precise valuation.
- Customizable Parameters: Adjust WACC, tax rates, revenue growth, and capital expenditures as needed.
- Automated Calculations: Dynamic computation of intrinsic value and NPV.
- Scenario Testing: Analyze various scenarios to assess Relo Group's future performance.
- User-Friendly Interface: Designed for professionals, yet straightforward enough for newcomers.
Key Features
- Authentic Relo Financials: Gain access to precise, pre-loaded historical data and future forecasts.
- Adjustable Forecast Parameters: Modify highlighted fields such as WACC, growth rates, and profit margins to fit your analysis.
- Real-Time Calculations: Enjoy automatic updates for DCF, Net Present Value (NPV), and cash flow assessments.
- Interactive Dashboard: Utilize clear charts and summaries to effectively visualize your valuation outcomes.
- Suitable for All Skill Levels: An easy-to-navigate interface designed for investors, CFOs, and consultants alike.
How It Works
- 1. Access the Template: Download and open the Excel file containing Relo Group, Inc.'s preloaded data.
- 2. Adjust Assumptions: Modify essential inputs such as growth rates, WACC, and capital expenditures to fit your analysis.
- 3. Get Instant Results: The DCF model automatically calculates the intrinsic value and NPV based on your inputs.
- 4. Explore Scenarios: Evaluate various forecasts to see how different assumptions affect valuation outcomes.
- 5. Present with Confidence: Share professional valuation findings to strengthen your financial decisions regarding Relo Group, Inc. (8876T).
Why Opt for Relo Group, Inc. (8876T) Calculator?
- Precision: Utilizes real financial data from Relo Group to ensure accuracy.
- Versatility: Built to allow users to experiment with and adjust inputs effortlessly.
- Efficiency: Eliminates the need to construct a financial model from the ground up.
- Expert-Level Quality: Crafted with the precision and functionality suited for corporate executives.
- User-Centric: Intuitive design makes it accessible for individuals without extensive financial modeling skills.
Who Can Benefit from Relo Group, Inc. (8876T)?
- Investors: Evaluate Relo Group’s valuation to make informed decisions on buying or selling stocks.
- CFOs and Financial Analysts: Optimize valuation methodologies and assess financial projections.
- Startup Founders: Gain insights into how established firms like Relo Group are valued.
- Consultants: Create detailed valuation reports for your clients leveraging Relo Group’s metrics.
- Students and Educators: Utilize real-time data to learn and teach valuation strategies effectively.
Contents of the Template
- Operating and Balance Sheet Data: Pre-filled historical and forecast data for Relo Group, Inc. (8876T), including revenue, EBITDA, EBIT, and capital expenditures.
- WACC Calculation: A dedicated sheet for calculating the Weighted Average Cost of Capital (WACC), featuring parameters such as Beta, risk-free rate, and share price.
- DCF Valuation (Unlevered and Levered): Customizable Discounted Cash Flow models that provide intrinsic value along with comprehensive calculations.
- Financial Statements: Pre-loaded annual and quarterly financial statements to facilitate in-depth analysis.
- Key Ratios: A collection of profitability, leverage, and efficiency ratios relevant to Relo Group, Inc. (8876T).
- Dashboard and Charts: A visual summary of valuation outputs and assumptions for easy result analysis.
Disclaimer
All information, articles, and product details provided on this website are for general informational and educational purposes only. We do not claim any ownership over, nor do we intend to infringe upon, any trademarks, copyrights, logos, brand names, or other intellectual property mentioned or depicted on this site. Such intellectual property remains the property of its respective owners, and any references here are made solely for identification or informational purposes, without implying any affiliation, endorsement, or partnership.
We make no representations or warranties, express or implied, regarding the accuracy, completeness, or suitability of any content or products presented. Nothing on this website should be construed as legal, tax, investment, financial, medical, or other professional advice. In addition, no part of this site—including articles or product references—constitutes a solicitation, recommendation, endorsement, advertisement, or offer to buy or sell any securities, franchises, or other financial instruments, particularly in jurisdictions where such activity would be unlawful.
All content is of a general nature and may not address the specific circumstances of any individual or entity. It is not a substitute for professional advice or services. Any actions you take based on the information provided here are strictly at your own risk. You accept full responsibility for any decisions or outcomes arising from your use of this website and agree to release us from any liability in connection with your use of, or reliance upon, the content or products found herein.