
|
Japan Real Estate Investment Corporation (8952.T) Valoración de DCF |
Completamente Editable: Adáptelo A Sus Necesidades En Excel O Sheets
Diseño Profesional: Plantillas Confiables Y Estándares De La Industria
Predeterminadas Para Un Uso Rápido Y Eficiente
Compatible con MAC / PC, completamente desbloqueado
No Se Necesita Experiencia; Fáciles De Seguir
Japan Real Estate Investment Corporation (8952.T) Bundle
¡Simplifique la valoración de la Corporación de Inversión Real Estate bienes (8952T) con esta calculadora DCF personalizable! Con la Real Japan Real Estate Investment Corporation (8952T) Financials y los insumos de pronóstico ajustables, puede probar escenarios y descubrir el valor razonable de Japan Real Estate Investment Corporation (8952T) en minutos.
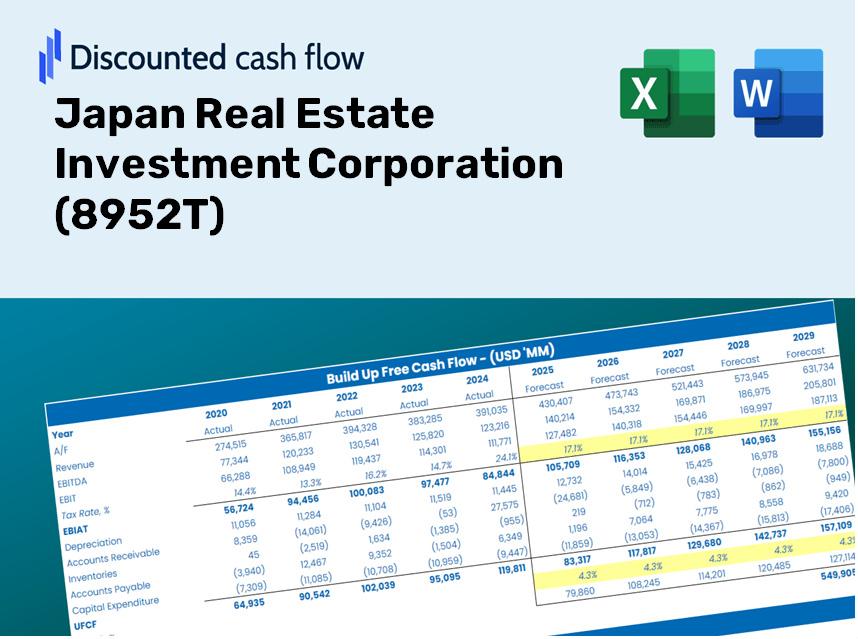
Discounted Cash Flow (DCF) - (USD MM)
| Year | AY1 2020 |
AY2 2021 |
AY3 2022 |
AY4 2023 |
AY5 2024 |
FY1 2025 |
FY2 2026 |
FY3 2027 |
FY4 2028 |
FY5 2029 |
|---|---|---|---|---|---|---|---|---|---|---|
| Revenue | 70,962.6 | 71,845.6 | 74,108.2 | 75,973.1 | 83,995.8 | 87,664.3 | 91,493.1 | 95,489.0 | 99,659.5 | 104,012.1 |
| Revenue Growth, % | 0 | 1.24 | 3.15 | 2.52 | 10.56 | 4.37 | 4.37 | 4.37 | 4.37 | 4.37 |
| EBITDA | 46,898.9 | 47,670.2 | 47,751.6 | 47,549.9 | 53,326.1 | 56,622.4 | 59,095.4 | 61,676.4 | 64,370.1 | 67,181.4 |
| EBITDA, % | 66.09 | 66.35 | 64.43 | 62.59 | 63.49 | 64.59 | 64.59 | 64.59 | 64.59 | 64.59 |
| Depreciation | 13,046.2 | 12,795.8 | 12,602.0 | 12,460.1 | 12,426.0 | 14,796.7 | 15,442.9 | 16,117.4 | 16,821.3 | 17,556.0 |
| Depreciation, % | 18.38 | 17.81 | 17 | 16.4 | 14.79 | 16.88 | 16.88 | 16.88 | 16.88 | 16.88 |
| EBIT | 33,852.8 | 34,874.4 | 35,149.5 | 35,089.8 | 40,900.0 | 41,825.7 | 43,652.5 | 45,559.0 | 47,548.8 | 49,625.4 |
| EBIT, % | 47.71 | 48.54 | 47.43 | 46.19 | 48.69 | 47.71 | 47.71 | 47.71 | 47.71 | 47.71 |
| Total Cash | 21,499.9 | 37,566.1 | 20,473.6 | 29,088.6 | 23,256.0 | 30,890.6 | 32,239.7 | 33,647.8 | 35,117.3 | 36,651.1 |
| Total Cash, percent | .0 | .0 | .0 | .0 | .0 | .0 | .0 | .0 | .0 | .0 |
| Account Receivables | 430.7 | 339.1 | 466.4 | 567.3 | 755.9 | 588.2 | 613.9 | 640.7 | 668.7 | 697.9 |
| Account Receivables, % | 0.60687 | 0.472 | 0.62931 | 0.74674 | 0.89992 | 0.67097 | 0.67097 | 0.67097 | 0.67097 | 0.67097 |
| Inventories | 7,424.0 | 7,116.2 | .0 | .0 | .0 | 3,570.9 | 3,726.8 | 3,889.6 | 4,059.5 | 4,236.8 |
| Inventories, % | 10.46 | 9.9 | 0 | 0 | 0 | 4.07 | 4.07 | 4.07 | 4.07 | 4.07 |
| Accounts Payable | 1,079.9 | 1,325.8 | 1,540.9 | 3,232.4 | 4,040.0 | 2,544.1 | 2,655.3 | 2,771.2 | 2,892.3 | 3,018.6 |
| Accounts Payable, % | 1.52 | 1.85 | 2.08 | 4.25 | 4.81 | 2.9 | 2.9 | 2.9 | 2.9 | 2.9 |
| Capital Expenditure | -55,893.1 | -3,438.2 | -56,858.8 | -64,561.7 | -50,369.4 | -53,513.8 | -55,851.0 | -58,290.3 | -60,836.2 | -63,493.2 |
| Capital Expenditure, % | -78.76 | -4.79 | -76.72 | -84.98 | -59.97 | -61.04 | -61.04 | -61.04 | -61.04 | -61.04 |
| Tax Rate, % | 3.5 | 3.5 | 3.5 | 3.5 | 3.5 | 3.5 | 3.5 | 3.5 | 3.5 | 3.5 |
| EBITAT | 33,237.4 | 34,283.1 | 34,506.6 | 35,065.7 | 39,470.1 | 41,080.6 | 42,874.8 | 44,747.3 | 46,701.7 | 48,741.4 |
| Depreciation | ||||||||||
| Changes in Account Receivables | ||||||||||
| Changes in Inventories | ||||||||||
| Changes in Accounts Payable | ||||||||||
| Capital Expenditure | ||||||||||
| UFCF | -16,384.4 | 44,285.9 | -2,546.1 | -15,445.3 | 2,145.8 | -2,535.6 | 2,396.1 | 2,500.8 | 2,610.0 | 2,724.0 |
| WACC, % | 5.02 | 5.03 | 5.02 | 5.05 | 5 | 5.02 | 5.02 | 5.02 | 5.02 | 5.02 |
| PV UFCF | ||||||||||
| SUM PV UFCF | 6,193.9 | |||||||||
| Long Term Growth Rate, % | 2.00 | |||||||||
| Free cash flow (T + 1) | 2,778 | |||||||||
| Terminal Value | 91,866 | |||||||||
| Present Terminal Value | 71,895 | |||||||||
| Enterprise Value | 78,089 | |||||||||
| Net Debt | 434,636 | |||||||||
| Equity Value | -356,547 | |||||||||
| Diluted Shares Outstanding, MM | 7 | |||||||||
| Equity Value Per Share | -50,116.84 |
What You Will Receive
- Pre-Filled Financial Model: Utilize Japan Real Estate Investment Corporation's (8952T) actual data for accurate DCF valuation.
- Comprehensive Forecast Control: Modify revenue growth, profit margins, WACC, and other essential parameters.
- Immediate Calculations: Automated updates provide real-time results as you implement changes.
- Investor-Ready Template: A polished Excel spreadsheet crafted for high-quality valuation.
- Customizable and Reusable: Designed for adaptability, perfect for repeated use in detailed forecasts.
Key Features
- Customizable Investment Parameters: Adjust essential inputs such as rental income growth, operating expenses, and capital improvements.
- Instant DCF Valuation: Quickly computes intrinsic value, NPV, and other financial metrics.
- High-Precision Accuracy: Leverages Japan Real Estate Investment Corporation’s real-world data for authentic valuation results.
- Simplified Scenario Analysis: Effortlessly evaluate various assumptions and compare results.
- Efficient Valuation Tool: Avoid the complexity of constructing intricate valuation models from the ground up.
How It Works
- 1. Access the Template: Download and open the Excel file featuring Japan Real Estate Investment Corporation’s (8952T) preloaded data.
- 2. Adjust Key Inputs: Modify essential assumptions such as growth rates, WACC, and capital expenditures to reflect your analysis.
- 3. Immediate Results: The DCF model automatically computes intrinsic value and NPV for your convenience.
- 4. Analyze Different Scenarios: Evaluate various forecasts to explore a range of valuation possibilities.
- 5. Present with Assurance: Share professional valuation insights based on thorough analysis to bolster your decision-making.
Why Choose This Calculator for Japan Real Estate Investment Corporation (8952T)?
- Reliable Data: Accurate financials of Japan Real Estate Investment Corporation provide trustworthy valuation outcomes.
- Flexible Customization: Modify essential parameters such as growth rates, WACC, and tax rates to align with your forecasts.
- Efficient: Built-in calculations save you the hassle of starting from scratch.
- Professional Quality: Tailored for investors, analysts, and real estate consultants.
- Easy to Use: Intuitive design and clear, step-by-step guidance ensure accessibility for all users.
Who Can Benefit from This Product?
- Real Estate Students: Master valuation methods and apply them to actual market data.
- Researchers: Integrate industry-standard models into your academic projects or studies.
- Investors: Evaluate your hypotheses and assess property valuations related to Japan Real Estate Investment Corporation (8952T).
- Market Analysts: Enhance your analysis with a ready-to-use, customizable DCF model.
- Property Developers: Learn how major real estate firms like Japan Real Estate Investment Corporation (8952T) are evaluated.
Contents of the Template
- Historical Data: Comprehensive financial records and baseline projections for Japan Real Estate Investment Corporation (8952T).
- DCF and Levered DCF Models: In-depth templates for calculating the intrinsic value of Japan Real Estate Investment Corporation (8952T).
- WACC Sheet: Pre-constructed calculations for the Weighted Average Cost of Capital.
- Editable Inputs: Customize essential drivers such as growth rates, EBITDA %, and CAPEX assumptions.
- Quarterly and Annual Statements: A thorough analysis of Japan Real Estate Investment Corporation (8952T)’s financial performance.
- Interactive Dashboard: Dynamic visualization of valuation outcomes and forecasts.
Disclaimer
All information, articles, and product details provided on this website are for general informational and educational purposes only. We do not claim any ownership over, nor do we intend to infringe upon, any trademarks, copyrights, logos, brand names, or other intellectual property mentioned or depicted on this site. Such intellectual property remains the property of its respective owners, and any references here are made solely for identification or informational purposes, without implying any affiliation, endorsement, or partnership.
We make no representations or warranties, express or implied, regarding the accuracy, completeness, or suitability of any content or products presented. Nothing on this website should be construed as legal, tax, investment, financial, medical, or other professional advice. In addition, no part of this site—including articles or product references—constitutes a solicitation, recommendation, endorsement, advertisement, or offer to buy or sell any securities, franchises, or other financial instruments, particularly in jurisdictions where such activity would be unlawful.
All content is of a general nature and may not address the specific circumstances of any individual or entity. It is not a substitute for professional advice or services. Any actions you take based on the information provided here are strictly at your own risk. You accept full responsibility for any decisions or outcomes arising from your use of this website and agree to release us from any liability in connection with your use of, or reliance upon, the content or products found herein.