
|
Fukuoka Reit Corporation (8968.T) Valoración de DCF |
Completamente Editable: Adáptelo A Sus Necesidades En Excel O Sheets
Diseño Profesional: Plantillas Confiables Y Estándares De La Industria
Predeterminadas Para Un Uso Rápido Y Eficiente
Compatible con MAC / PC, completamente desbloqueado
No Se Necesita Experiencia; Fáciles De Seguir
Fukuoka REIT Corporation (8968.T) Bundle
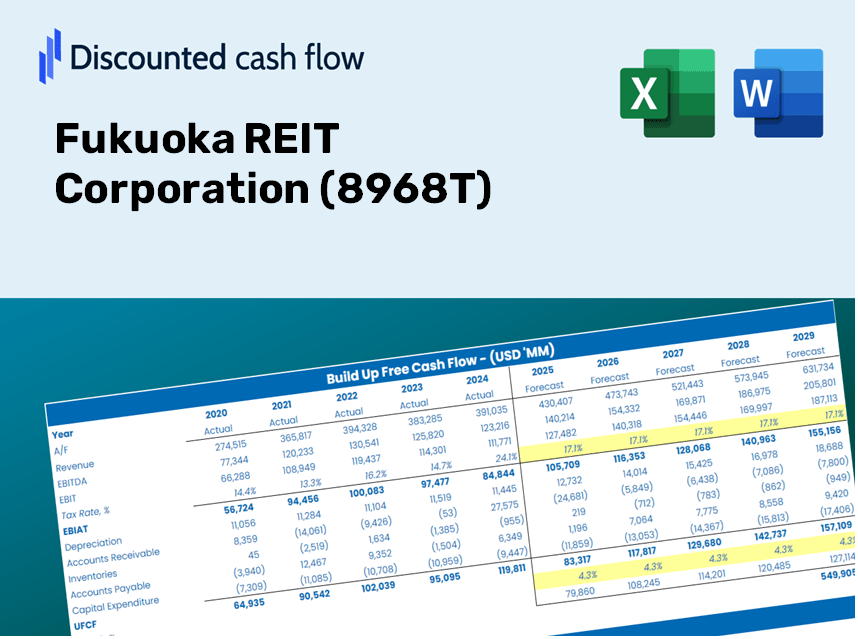
¡Obtenga información sobre su análisis de valoración de Fukuoka REIT Corporation (8968T) con nuestra sofisticada calculadora DCF! Esta plantilla de Excel viene precargada con datos reales (8968T), lo que le permite ajustar los pronósticos y supuestos para un cálculo preciso del valor intrínseco de Fukuoka Reit Corporation.
Discounted Cash Flow (DCF) - (USD MM)
| Year | AY1 2020 |
AY2 2021 |
AY3 2022 |
AY4 2023 |
AY5 2024 |
FY1 2025 |
FY2 2026 |
FY3 2027 |
FY4 2028 |
FY5 2029 |
|---|---|---|---|---|---|---|---|---|---|---|
| Revenue | 17,681.1 | 17,771.3 | 17,489.5 | 17,774.3 | 18,978.9 | 19,326.7 | 19,680.9 | 20,041.5 | 20,408.8 | 20,782.8 |
| Revenue Growth, % | 0 | 0.51027 | -1.59 | 1.63 | 6.78 | 1.83 | 1.83 | 1.83 | 1.83 | 1.83 |
| EBITDA | 9,587.2 | 9,338.9 | 9,368.7 | 9,429.6 | 10,110.8 | 10,307.6 | 10,496.5 | 10,688.8 | 10,884.7 | 11,084.2 |
| EBITDA, % | 54.22 | 52.55 | 53.57 | 53.05 | 53.27 | 53.33 | 53.33 | 53.33 | 53.33 | 53.33 |
| Depreciation | 3,346.9 | 3,176.5 | 3,000.9 | 3,031.3 | 3,221.0 | 3,401.0 | 3,463.4 | 3,526.8 | 3,591.5 | 3,657.3 |
| Depreciation, % | 18.93 | 17.87 | 17.16 | 17.05 | 16.97 | 17.6 | 17.6 | 17.6 | 17.6 | 17.6 |
| EBIT | 6,240.4 | 6,162.4 | 6,367.7 | 6,398.3 | 6,889.7 | 6,906.5 | 7,033.1 | 7,162.0 | 7,293.2 | 7,426.9 |
| EBIT, % | 35.29 | 34.68 | 36.41 | 36 | 36.3 | 35.74 | 35.74 | 35.74 | 35.74 | 35.74 |
| Total Cash | 3,733.6 | 6,949.0 | 4,203.3 | 6,267.2 | 3,883.0 | 5,410.4 | 5,509.5 | 5,610.5 | 5,713.3 | 5,818.0 |
| Total Cash, percent | .0 | .0 | .0 | .0 | .0 | .0 | .0 | .0 | .0 | .0 |
| Account Receivables | 1,043.9 | 593.0 | 788.4 | 791.1 | 1,075.2 | 922.5 | 939.4 | 956.6 | 974.1 | 992.0 |
| Account Receivables, % | 5.9 | 3.34 | 4.51 | 4.45 | 5.67 | 4.77 | 4.77 | 4.77 | 4.77 | 4.77 |
| Inventories | 4,942.8 | 4,288.4 | 4,506.7 | .0 | .4 | 3,009.4 | 3,064.5 | 3,120.7 | 3,177.9 | 3,236.1 |
| Inventories, % | 27.96 | 24.13 | 25.77 | 0 | 0.00196007 | 15.57 | 15.57 | 15.57 | 15.57 | 15.57 |
| Accounts Payable | 341.0 | 452.7 | 661.8 | 771.1 | 574.2 | 603.9 | 615.0 | 626.2 | 637.7 | 649.4 |
| Accounts Payable, % | 1.93 | 2.55 | 3.78 | 4.34 | 3.03 | 3.12 | 3.12 | 3.12 | 3.12 | 3.12 |
| Capital Expenditure | -7,470.2 | -9,606.6 | -6,439.4 | -5,155.7 | -16,247.1 | -9,575.9 | -9,751.4 | -9,930.1 | -10,112.1 | -10,297.4 |
| Capital Expenditure, % | -42.25 | -54.06 | -36.82 | -29.01 | -85.61 | -49.55 | -49.55 | -49.55 | -49.55 | -49.55 |
| Tax Rate, % | 0.06635327 | 0.06635327 | 0.06635327 | 0.06635327 | 0.06635327 | 0.06635327 | 0.06635327 | 0.06635327 | 0.06635327 | 0.06635327 |
| EBITAT | 6,238.1 | 6,159.3 | 6,364.8 | 6,396.2 | 6,885.1 | 6,903.3 | 7,029.8 | 7,158.6 | 7,289.8 | 7,423.4 |
| Depreciation | ||||||||||
| Changes in Account Receivables | ||||||||||
| Changes in Inventories | ||||||||||
| Changes in Accounts Payable | ||||||||||
| Capital Expenditure | ||||||||||
| UFCF | -3,531.0 | 946.2 | 2,721.6 | 8,885.1 | -6,622.3 | -2,098.1 | 680.8 | 693.3 | 706.0 | 718.9 |
| WACC, % | 4.99 | 4.99 | 4.99 | 4.99 | 4.99 | 4.99 | 4.99 | 4.99 | 4.99 | 4.99 |
| PV UFCF | ||||||||||
| SUM PV UFCF | 363.1 | |||||||||
| Long Term Growth Rate, % | 2.00 | |||||||||
| Free cash flow (T + 1) | 733 | |||||||||
| Terminal Value | 24,563 | |||||||||
| Present Terminal Value | 19,259 | |||||||||
| Enterprise Value | 19,622 | |||||||||
| Net Debt | 92,467 | |||||||||
| Equity Value | -72,844 | |||||||||
| Diluted Shares Outstanding, MM | 1 | |||||||||
| Equity Value Per Share | -91,513.13 |
Your Benefits
- Authentic [Symbol] Financial Data: Pre-loaded with Fukuoka REIT Corporation’s historical and projected figures for detailed analysis.
- Completely Customizable Template: Easily adjust essential inputs like revenue growth, WACC, and EBITDA percentage.
- Instant Calculations: Watch Fukuoka REIT Corporation’s intrinsic value update automatically as you make changes.
- Expert Valuation Tool: Tailored for investors, analysts, and consultants aiming for accurate DCF outcomes.
- User-Friendly Layout: Intuitive design and straightforward guidelines suitable for all skill levels.
Key Features
- 🔍 Real-Time Fukuoka REIT Financials: Access pre-filled historical and projected data for Fukuoka REIT Corporation (8968T).
- ✏️ Fully Customizable Inputs: Modify crucial parameters (yellow cells) such as WACC, growth %, and tax rates.
- 📊 Comprehensive DCF Valuation: Utilize built-in formulas to determine Fukuoka REIT’s intrinsic value using the Discounted Cash Flow method.
- ⚡ Instant Results: Visualize Fukuoka REIT’s valuation immediately after adjustments.
- Scenario Analysis: Evaluate and compare different financial assumptions side-by-side.
How It Works
- 1. Access the Template: Download and open the Excel file featuring Fukuoka REIT Corporation's preloaded data.
- 2. Modify Parameters: Adjust key inputs such as growth forecasts, WACC, and capital expenditures.
- 3. See Immediate Results: The DCF model automatically calculates the intrinsic value and NPV.
- 4. Explore Scenarios: Evaluate various forecasts to understand different valuation possibilities.
- 5. Present with Confidence: Share professional valuation insights to inform your decisions regarding Fukuoka REIT Corporation (8968T).
Why Opt for the Fukuoka REIT Corporation Calculator?
- Time-Saving: No need to construct a DCF model from the ground up – it's ready for immediate use.
- Enhanced Accuracy: Dependable financial data and formulas minimize valuation errors.
- Completely Customizable: Adjust the model to align with your assumptions and forecasts.
- User-Friendly: Intuitive charts and outputs simplify result analysis.
- Built for Professionals: Crafted for experts who prioritize precision and functionality.
Who Can Benefit from This Product?
- Real Estate Students: Discover valuation methodologies and apply them using actual market data.
- Researchers: Integrate industry-standard models into your studies or research projects.
- Investors: Validate your assumptions and evaluate valuation results for Fukuoka REIT Corporation (8968T).
- Market Analysts: Enhance your productivity with a ready-to-use, customizable DCF model.
- Property Owners: Understand how major public real estate companies like Fukuoka REIT Corporation (8968T) are evaluated.
Contents of the Template
- Thorough DCF Model: An editable template featuring extensive valuation calculations.
- Real-World Data: Fukuoka REIT Corporation's historical and projected financials are preloaded for analysis.
- Customizable Parameters: Modify WACC, growth rates, and tax assumptions to explore different scenarios.
- Financial Statements: Complete annual and quarterly financial breakdowns for enhanced insights.
- Key Ratios: Integrated analysis of profitability, efficiency, and leverage metrics.
- Dashboard with Visual Outputs: Visualizations including charts and tables for clear and actionable insights.
Disclaimer
All information, articles, and product details provided on this website are for general informational and educational purposes only. We do not claim any ownership over, nor do we intend to infringe upon, any trademarks, copyrights, logos, brand names, or other intellectual property mentioned or depicted on this site. Such intellectual property remains the property of its respective owners, and any references here are made solely for identification or informational purposes, without implying any affiliation, endorsement, or partnership.
We make no representations or warranties, express or implied, regarding the accuracy, completeness, or suitability of any content or products presented. Nothing on this website should be construed as legal, tax, investment, financial, medical, or other professional advice. In addition, no part of this site—including articles or product references—constitutes a solicitation, recommendation, endorsement, advertisement, or offer to buy or sell any securities, franchises, or other financial instruments, particularly in jurisdictions where such activity would be unlawful.
All content is of a general nature and may not address the specific circumstances of any individual or entity. It is not a substitute for professional advice or services. Any actions you take based on the information provided here are strictly at your own risk. You accept full responsibility for any decisions or outcomes arising from your use of this website and agree to release us from any liability in connection with your use of, or reliance upon, the content or products found herein.