
|
Daiwa Securities Living Investment Corporation (8986.T) Valoración de DCF |
Completamente Editable: Adáptelo A Sus Necesidades En Excel O Sheets
Diseño Profesional: Plantillas Confiables Y Estándares De La Industria
Predeterminadas Para Un Uso Rápido Y Eficiente
Compatible con MAC / PC, completamente desbloqueado
No Se Necesita Experiencia; Fáciles De Seguir
Daiwa Securities Living Investment Corporation (8986.T) Bundle
¡Obtenga información sobre su análisis de valoración de Daiwa Securities Living Investment Corporation (8986T) utilizando nuestra sofisticada calculadora DCF! Equipado con datos reales (8986T), esta plantilla de Excel le permite ajustar los pronósticos y los supuestos para determinar con precisión el valor intrínseco de Daiwa Securities Living Investment Corporation.
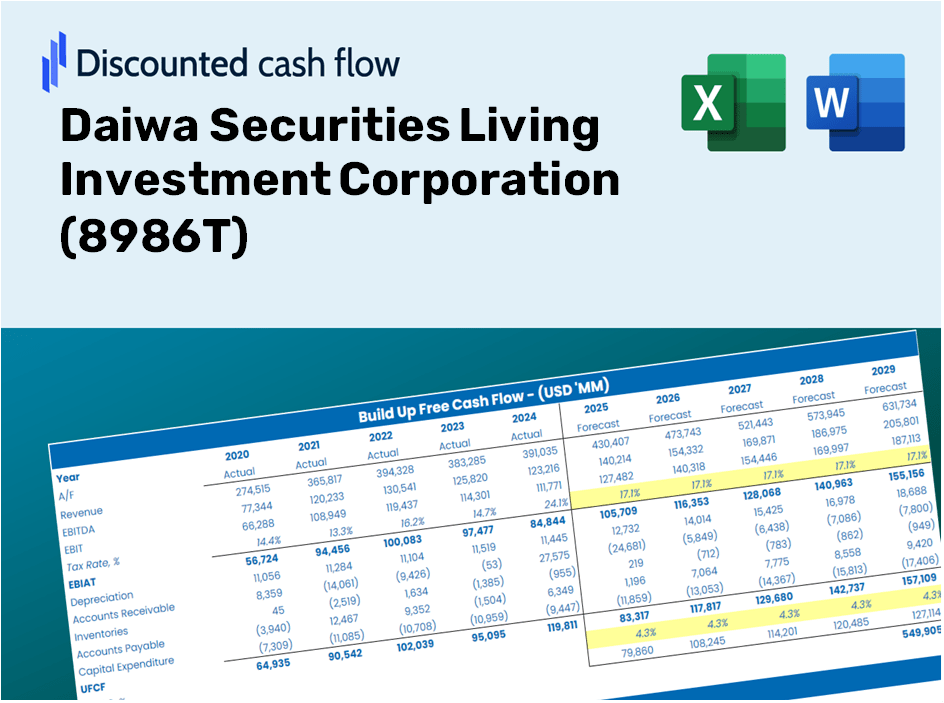
Discounted Cash Flow (DCF) - (USD MM)
| Year | AY1 2020 |
AY2 2021 |
AY3 2022 |
AY4 2023 |
AY5 2024 |
FY1 2025 |
FY2 2026 |
FY3 2027 |
FY4 2028 |
FY5 2029 |
|---|---|---|---|---|---|---|---|---|---|---|
| Revenue | 32,099.0 | 21,299.7 | 22,699.8 | 24,667.8 | 27,439.5 | 26,948.0 | 26,465.3 | 25,991.3 | 25,525.8 | 25,068.6 |
| Revenue Growth, % | 0 | -33.64 | 6.57 | 8.67 | 11.24 | -1.79 | -1.79 | -1.79 | -1.79 | -1.79 |
| EBITDA | 13,371.5 | 14,658.1 | 15,673.6 | 17,142.2 | 18,678.9 | 17,089.8 | 16,783.7 | 16,483.1 | 16,187.8 | 15,897.9 |
| EBITDA, % | 41.66 | 68.82 | 69.05 | 69.49 | 68.07 | 63.42 | 63.42 | 63.42 | 63.42 | 63.42 |
| Depreciation | 4,354.4 | 4,775.6 | 5,007.2 | 5,334.8 | 5,352.2 | 5,345.2 | 5,249.5 | 5,155.5 | 5,063.1 | 4,972.4 |
| Depreciation, % | 13.57 | 22.42 | 22.06 | 21.63 | 19.51 | 19.84 | 19.84 | 19.84 | 19.84 | 19.84 |
| EBIT | 9,017.1 | 9,882.5 | 10,666.4 | 11,807.4 | 13,326.7 | 11,744.5 | 11,534.2 | 11,327.6 | 11,124.7 | 10,925.4 |
| EBIT, % | 28.09 | 46.4 | 46.99 | 47.87 | 48.57 | 43.58 | 43.58 | 43.58 | 43.58 | 43.58 |
| Total Cash | 14,923.5 | 12,079.8 | 14,773.8 | 18,701.0 | 8,171.0 | 14,761.0 | 14,496.6 | 14,236.9 | 13,981.9 | 13,731.5 |
| Total Cash, percent | .0 | .0 | .0 | .0 | .0 | .0 | .0 | .0 | .0 | .0 |
| Account Receivables | 227.4 | 165.8 | 150.5 | 148.0 | 156.1 | 178.8 | 175.6 | 172.5 | 169.4 | 166.4 |
| Account Receivables, % | 0.70858 | 0.77819 | 0.66283 | 0.59997 | 0.56886 | 0.66369 | 0.66369 | 0.66369 | 0.66369 | 0.66369 |
| Inventories | .0 | 3,190.3 | 3,417.6 | .0 | .2 | 1,618.7 | 1,589.7 | 1,561.3 | 1,533.3 | 1,505.8 |
| Inventories, % | 0 | 14.98 | 15.06 | 0 | 0.000736165581 | 6.01 | 6.01 | 6.01 | 6.01 | 6.01 |
| Accounts Payable | 834.0 | 343.1 | 525.5 | 615.6 | 637.8 | 611.4 | 600.5 | 589.7 | 579.1 | 568.8 |
| Accounts Payable, % | 2.6 | 1.61 | 2.32 | 2.5 | 2.32 | 2.27 | 2.27 | 2.27 | 2.27 | 2.27 |
| Capital Expenditure | -72,333.3 | -29,002.3 | -18,253.4 | -23,252.0 | -56,996.4 | -25,583.0 | -25,124.7 | -24,674.7 | -24,232.8 | -23,798.7 |
| Capital Expenditure, % | -225.34 | -136.16 | -80.41 | -94.26 | -207.72 | -94.93 | -94.93 | -94.93 | -94.93 | -94.93 |
| Tax Rate, % | 0.01006793 | 0.01006793 | 0.01006793 | 0.01006793 | 0.01006793 | 0.01006793 | 0.01006793 | 0.01006793 | 0.01006793 | 0.01006793 |
| EBITAT | 9,015.9 | 9,881.1 | 10,665.0 | 11,806.0 | 13,325.4 | 11,743.1 | 11,532.8 | 11,326.2 | 11,123.3 | 10,924.1 |
| Depreciation | ||||||||||
| Changes in Account Receivables | ||||||||||
| Changes in Inventories | ||||||||||
| Changes in Accounts Payable | ||||||||||
| Capital Expenditure | ||||||||||
| UFCF | -58,356.5 | -17,965.0 | -2,610.7 | -2,601.1 | -38,304.9 | -10,162.3 | -8,321.2 | -8,172.2 | -8,025.8 | -7,882.1 |
| WACC, % | 4.12 | 4.12 | 4.12 | 4.12 | 4.12 | 4.12 | 4.12 | 4.12 | 4.12 | 4.12 |
| PV UFCF | ||||||||||
| SUM PV UFCF | -37,943.7 | |||||||||
| Long Term Growth Rate, % | 3.00 | |||||||||
| Free cash flow (T + 1) | -8,119 | |||||||||
| Terminal Value | -723,376 | |||||||||
| Present Terminal Value | -591,078 | |||||||||
| Enterprise Value | -629,022 | |||||||||
| Net Debt | 196,566 | |||||||||
| Equity Value | -825,588 | |||||||||
| Diluted Shares Outstanding, MM | 2 | |||||||||
| Equity Value Per Share | -343,708.44 |
What You Will Receive
- Comprehensive (8986T) Financials: Access to both historical data and future projections for precise valuation.
- Customizable Parameters: Adjust metrics such as WACC, tax rates, revenue growth, and capital expenditures.
- Real-Time Calculations: Automatically calculates intrinsic value and NPV with ease.
- Scenario Testing: Evaluate various scenarios to assess the future outlook of Daiwa Securities Living Investment Corporation.
- User-Friendly Interface: Designed for industry professionals while remaining accessible to newcomers.
Key Features
- Genuine Daiwa Financials: Get reliable pre-loaded historical data and future forecasts for (8986T).
- Tailored Forecast Assumptions: Modify highlighted cells, including WACC, growth rates, and margins to suit your analysis.
- Real-time Calculations: Automatic recalculations for DCF, Net Present Value (NPV), and cash flow assessments.
- Intuitive Visual Dashboard: User-friendly charts and summaries that clearly present your valuation outcomes.
- Designed for All Skill Levels: A straightforward and user-friendly layout perfect for investors, CFOs, and consultants alike.
How It Functions
- Step 1: Obtain the prebuilt Excel template containing Daiwa Securities Living Investment Corporation’s data.
- Step 2: Browse through the pre-filled sheets to familiarize yourself with the essential metrics.
- Step 3: Modify the forecasts and assumptions in the editable yellow cells (WACC, growth, margins).
- Step 4: Immediately see the recalculated results, including the intrinsic value of Daiwa Securities Living Investment Corporation (8986T).
- Step 5: Utilize the outputs to make informed investment decisions or generate detailed reports.
Reasons to Choose This Calculator for Daiwa Securities Living Investment Corporation (8986T)
- Reliable Data: Utilize authentic financials from Daiwa Securities for trustworthy valuation results.
- Fully Customizable: Modify essential parameters such as growth rates, WACC, and tax rates to reflect your forecasts.
- Efficiency Boost: Built-in calculations save you time by eliminating the need for starting from scratch.
- Expert-Level Resource: Tailored for investors, analysts, and financial consultants.
- Easy to Navigate: User-friendly design and clear instructions ensure accessibility for all users.
Who Can Benefit from This Product?
- Investors: Evaluate the valuation of Daiwa Securities Living Investment Corporation (8986T) prior to making stock transactions.
- CFOs and Financial Analysts: Enhance valuation processes and assess financial projections effectively.
- Startup Founders: Discover the valuation methods applied to prominent public firms like Daiwa Securities Living Investment Corporation (8986T).
- Consultants: Provide comprehensive valuation reports to clients with confidence.
- Students and Educators: Utilize current market data to hone and teach valuation strategies.
Contents of the Template
- Pre-Filled DCF Model: Financial data for Daiwa Securities Living Investment Corporation (8986T) preloaded for immediate analysis.
- WACC Calculator: Comprehensive calculations for the Weighted Average Cost of Capital.
- Financial Ratios: Assess the profitability, leverage, and efficiency of Daiwa Securities Living Investment Corporation (8986T).
- Editable Inputs: Adjust assumptions such as growth, margins, and CAPEX to align with your scenarios.
- Financial Statements: Access annual and quarterly reports for in-depth analysis.
- Interactive Dashboard: Effortlessly visualize key valuation metrics and results.
Disclaimer
All information, articles, and product details provided on this website are for general informational and educational purposes only. We do not claim any ownership over, nor do we intend to infringe upon, any trademarks, copyrights, logos, brand names, or other intellectual property mentioned or depicted on this site. Such intellectual property remains the property of its respective owners, and any references here are made solely for identification or informational purposes, without implying any affiliation, endorsement, or partnership.
We make no representations or warranties, express or implied, regarding the accuracy, completeness, or suitability of any content or products presented. Nothing on this website should be construed as legal, tax, investment, financial, medical, or other professional advice. In addition, no part of this site—including articles or product references—constitutes a solicitation, recommendation, endorsement, advertisement, or offer to buy or sell any securities, franchises, or other financial instruments, particularly in jurisdictions where such activity would be unlawful.
All content is of a general nature and may not address the specific circumstances of any individual or entity. It is not a substitute for professional advice or services. Any actions you take based on the information provided here are strictly at your own risk. You accept full responsibility for any decisions or outcomes arising from your use of this website and agree to release us from any liability in connection with your use of, or reliance upon, the content or products found herein.