
|
Keikyu Corporation (9006.T) Valoración de DCF |
Completamente Editable: Adáptelo A Sus Necesidades En Excel O Sheets
Diseño Profesional: Plantillas Confiables Y Estándares De La Industria
Predeterminadas Para Un Uso Rápido Y Eficiente
Compatible con MAC / PC, completamente desbloqueado
No Se Necesita Experiencia; Fáciles De Seguir
Keikyu Corporation (9006.T) Bundle
¡Descubra el verdadero valor de Keikyu Corporation con nuestra calculadora DCF de grado profesional! Ajuste los supuestos clave, explore varios escenarios y evalúe cómo los cambios afectan la valoración de Keikyu Corporation, todo dentro de una sola plantilla de Excel.
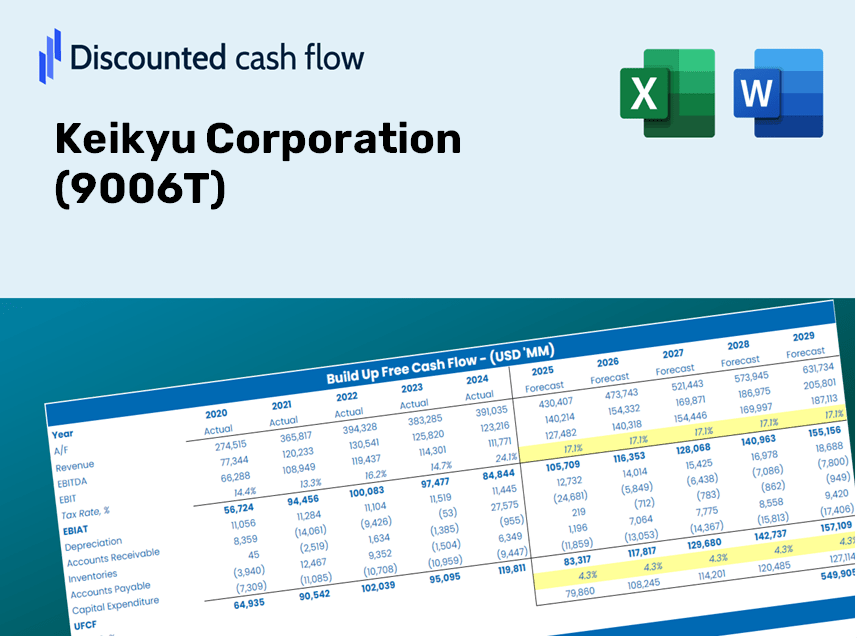
Discounted Cash Flow (DCF) - (USD MM)
| Year | AY1 2021 |
AY2 2022 |
AY3 2023 |
AY4 2024 |
AY5 2025 |
FY1 2026 |
FY2 2027 |
FY3 2028 |
FY4 2029 |
FY5 2030 |
|---|---|---|---|---|---|---|---|---|---|---|
| Revenue | 234,964.0 | 265,237.0 | 253,005.0 | 280,624.0 | 293,860.0 | 295,925.8 | 298,006.1 | 300,101.1 | 302,210.7 | 304,335.2 |
| Revenue Growth, % | 0 | 12.88 | -4.61 | 10.92 | 4.72 | 0.70299 | 0.70299 | 0.70299 | 0.70299 | 0.70299 |
| EBITDA | 2,789.0 | 53,831.0 | 54,306.0 | 151,193.0 | 64,243.0 | 70,244.5 | 70,738.3 | 71,235.6 | 71,736.4 | 72,240.7 |
| EBITDA, % | 1.19 | 20.3 | 21.46 | 53.88 | 21.86 | 23.74 | 23.74 | 23.74 | 23.74 | 23.74 |
| Depreciation | 31,712.0 | 29,567.0 | 28,309.0 | 28,170.0 | 28,541.0 | 32,897.4 | 33,128.6 | 33,361.5 | 33,596.1 | 33,832.2 |
| Depreciation, % | 13.5 | 11.15 | 11.19 | 10.04 | 9.71 | 11.12 | 11.12 | 11.12 | 11.12 | 11.12 |
| EBIT | -28,923.0 | 24,264.0 | 25,997.0 | 123,023.0 | 35,702.0 | 37,347.1 | 37,609.7 | 37,874.1 | 38,140.3 | 38,408.4 |
| EBIT, % | -12.31 | 9.15 | 10.28 | 43.84 | 12.15 | 12.62 | 12.62 | 12.62 | 12.62 | 12.62 |
| Total Cash | 57,600.0 | 61,384.0 | 57,119.0 | 149,223.0 | 74,454.0 | 88,035.4 | 88,654.2 | 89,277.5 | 89,905.1 | 90,537.1 |
| Total Cash, percent | .0 | .0 | .0 | .0 | .0 | .0 | .0 | .0 | .0 | .0 |
| Account Receivables | 9,629.0 | 12,181.0 | 14,053.0 | 16,021.0 | 19,636.0 | 15,764.7 | 15,875.5 | 15,987.1 | 16,099.5 | 16,212.6 |
| Account Receivables, % | 4.1 | 4.59 | 5.55 | 5.71 | 6.68 | 5.33 | 5.33 | 5.33 | 5.33 | 5.33 |
| Inventories | 50,512.0 | 49,160.0 | 58,018.0 | 68,484.0 | 74,091.0 | 66,631.2 | 67,099.6 | 67,571.3 | 68,046.3 | 68,524.7 |
| Inventories, % | 21.5 | 18.53 | 22.93 | 24.4 | 25.21 | 22.52 | 22.52 | 22.52 | 22.52 | 22.52 |
| Accounts Payable | 25,180.0 | 24,363.0 | 27,560.0 | 39,206.0 | 39,604.0 | 34,471.3 | 34,713.6 | 34,957.7 | 35,203.4 | 35,450.9 |
| Accounts Payable, % | 10.72 | 9.19 | 10.89 | 13.97 | 13.48 | 11.65 | 11.65 | 11.65 | 11.65 | 11.65 |
| Capital Expenditure | -44,305.0 | -40,904.0 | -55,954.0 | -72,852.0 | -75,755.0 | -63,999.0 | -64,448.9 | -64,902.0 | -65,358.2 | -65,817.7 |
| Capital Expenditure, % | -18.86 | -15.42 | -22.12 | -25.96 | -25.78 | -21.63 | -21.63 | -21.63 | -21.63 | -21.63 |
| Tax Rate, % | 23 | 23 | 23 | 23 | 23 | 23 | 23 | 23 | 23 | 23 |
| EBITAT | -23,822.5 | 14,933.6 | 18,396.3 | 86,378.8 | 27,489.4 | 27,030.8 | 27,220.8 | 27,412.1 | 27,604.8 | 27,798.9 |
| Depreciation | ||||||||||
| Changes in Account Receivables | ||||||||||
| Changes in Inventories | ||||||||||
| Changes in Accounts Payable | ||||||||||
| Capital Expenditure | ||||||||||
| UFCF | -71,376.5 | 1,579.6 | -16,781.7 | 40,908.8 | -28,548.6 | 2,127.6 | -4,436.4 | -4,467.6 | -4,499.0 | -4,530.6 |
| WACC, % | 4.39 | 3.98 | 4.16 | 4.15 | 4.29 | 4.2 | 4.2 | 4.2 | 4.2 | 4.2 |
| PV UFCF | ||||||||||
| SUM PV UFCF | -13,499.7 | |||||||||
| Long Term Growth Rate, % | 1.00 | |||||||||
| Free cash flow (T + 1) | -4,576 | |||||||||
| Terminal Value | -143,193 | |||||||||
| Present Terminal Value | -116,594 | |||||||||
| Enterprise Value | -130,093 | |||||||||
| Net Debt | 399,844 | |||||||||
| Equity Value | -529,937 | |||||||||
| Diluted Shares Outstanding, MM | 275 | |||||||||
| Equity Value Per Share | -1,927.74 |
Benefits You Will Receive
- Authentic Keikyu Corporation Data: Comprehensive financial information – including revenue and EBIT – derived from actual and forecasted figures.
- Complete Customization: Modify all essential parameters (yellow cells) such as WACC, growth %, and tax rates.
- Immediate Valuation Updates: Automatic recalculations to evaluate the effects of changes on Keikyu Corporation's fair value.
- Flexible Excel Template: Designed for easy modifications, scenario testing, and in-depth projections.
- Efficient and Precise: Avoid the hassle of constructing models from the ground up while ensuring accuracy and adaptability.
Key Features
- Real-Time Keikyu Data: Pre-populated with Keikyu Corporation’s historical performance metrics and future forecasts.
- Fully Customizable Parameters: Modify revenue growth rates, profit margins, WACC, tax liabilities, and capital investments.
- Dynamic Valuation Framework: Instantaneous recalculations of Net Present Value (NPV) and intrinsic worth in response to your adjustments.
- Scenario Analysis: Develop various forecasting scenarios to explore different valuation possibilities.
- User-Centric Interface: Intuitive, organized, and tailored for both experts and novices.
How It Functions
- Download the Template: Gain immediate access to the Excel-based Keikyu Corporation DCF Calculator.
- Input Your Assumptions: Modify the yellow-highlighted cells for growth rates, WACC, margins, and other variables.
- Instant Calculations: The model promptly recalculates Keikyu Corporation’s intrinsic value.
- Test Scenarios: Explore various assumptions to see how they impact the valuation.
- Analyze and Decide: Utilize the results to inform your investment decisions or financial evaluations.
Why Opt for This Calculator?
- Precise Data: Authentic Keikyu Corporation (9006T) financials guarantee trustworthy valuation outcomes.
- Flexible: Modify essential parameters such as growth rates, WACC, and tax rates to align with your forecasts.
- Efficient: Built-in calculations save you from starting from the ground up.
- Professional Quality: Tailored for investors, analysts, and consultants alike.
- User-Centric: An intuitive design and step-by-step guidance make it accessible for all users.
Who Should Utilize This Product?
- Investors: Accurately assess Keikyu Corporation’s fair value prior to making investment choices.
- CFOs: Utilize a professional-grade DCF model for financial reporting and analysis with Keikyu (9006T).
- Consultants: Efficiently tailor the template for valuation reports for your clients involving Keikyu (9006T).
- Entrepreneurs: Discover insights into the financial modeling practices of leading companies like Keikyu (9006T).
- Educators: Employ this resource as a teaching tool to illustrate valuation techniques relevant to Keikyu (9006T).
Overview of Template Features
- Pre-Filled DCF Model: Keikyu Corporation’s financial data preloaded for immediate application.
- WACC Calculator: Comprehensive calculations for the Weighted Average Cost of Capital.
- Financial Ratios: Assess Keikyu Corporation’s profitability, leverage, and operational efficiency.
- Editable Inputs: Modify assumptions like growth rates, profit margins, and CAPEX to align with your scenarios.
- Financial Statements: Annual and quarterly reports for in-depth analysis support.
- Interactive Dashboard: Effortlessly visualize essential valuation metrics and outcomes.
Disclaimer
All information, articles, and product details provided on this website are for general informational and educational purposes only. We do not claim any ownership over, nor do we intend to infringe upon, any trademarks, copyrights, logos, brand names, or other intellectual property mentioned or depicted on this site. Such intellectual property remains the property of its respective owners, and any references here are made solely for identification or informational purposes, without implying any affiliation, endorsement, or partnership.
We make no representations or warranties, express or implied, regarding the accuracy, completeness, or suitability of any content or products presented. Nothing on this website should be construed as legal, tax, investment, financial, medical, or other professional advice. In addition, no part of this site—including articles or product references—constitutes a solicitation, recommendation, endorsement, advertisement, or offer to buy or sell any securities, franchises, or other financial instruments, particularly in jurisdictions where such activity would be unlawful.
All content is of a general nature and may not address the specific circumstances of any individual or entity. It is not a substitute for professional advice or services. Any actions you take based on the information provided here are strictly at your own risk. You accept full responsibility for any decisions or outcomes arising from your use of this website and agree to release us from any liability in connection with your use of, or reliance upon, the content or products found herein.