
|
SEIBU Holdings Inc. (9024.T) Valoración de DCF |
Completamente Editable: Adáptelo A Sus Necesidades En Excel O Sheets
Diseño Profesional: Plantillas Confiables Y Estándares De La Industria
Predeterminadas Para Un Uso Rápido Y Eficiente
Compatible con MAC / PC, completamente desbloqueado
No Se Necesita Experiencia; Fáciles De Seguir
Seibu Holdings Inc. (9024.T) Bundle
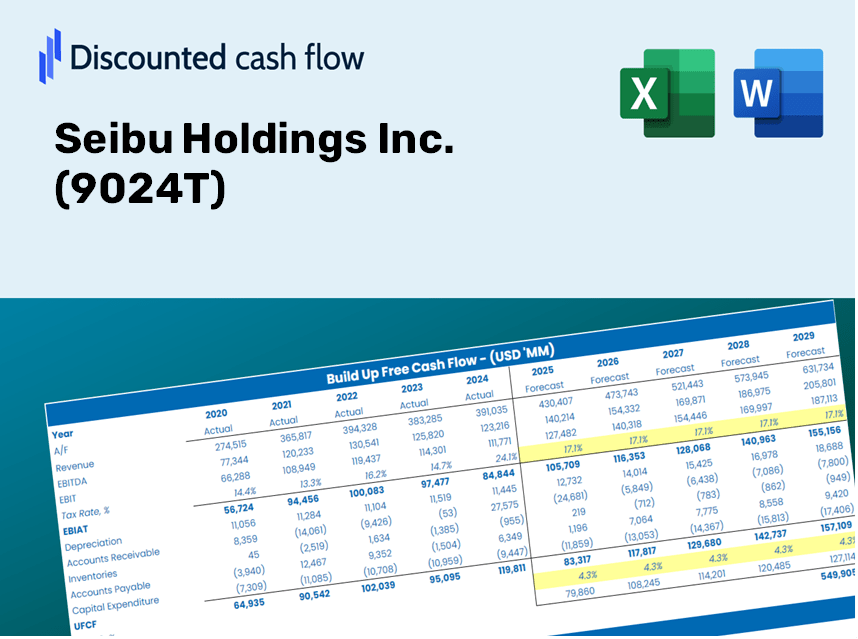
¡Obtenga información sobre su análisis de valoración de Seibu Holdings Inc. (9024T) con nuestra sofisticada calculadora DCF! Convenientemente precargado con datos reales (9024T), esta plantilla de Excel le permite ajustar los pronósticos y los supuestos para determinar con precisión el valor intrínseco de Seibu Holdings Inc.
Discounted Cash Flow (DCF) - (USD MM)
| Year | AY1 2021 |
AY2 2022 |
AY3 2023 |
AY4 2024 |
AY5 2025 |
FY1 2026 |
FY2 2027 |
FY3 2028 |
FY4 2029 |
FY5 2030 |
|---|---|---|---|---|---|---|---|---|---|---|
| Revenue | 337,061.0 | 396,856.0 | 428,487.0 | 477,598.0 | 901,131.0 | 921,370.1 | 942,063.8 | 963,222.3 | 984,855.9 | 1,006,975.5 |
| Revenue Growth, % | 0 | 17.74 | 7.97 | 11.46 | 88.68 | 2.25 | 2.25 | 2.25 | 2.25 | 2.25 |
| EBITDA | -3,684.0 | 95,136.0 | 124,776.0 | 101,868.0 | 411,877.0 | 219,351.5 | 224,278.1 | 229,315.3 | 234,465.6 | 239,731.6 |
| EBITDA, % | -1.09 | 23.97 | 29.12 | 21.33 | 45.71 | 23.81 | 23.81 | 23.81 | 23.81 | 23.81 |
| Depreciation | 58,327.0 | 57,088.0 | 55,092.0 | 54,156.0 | 54,390.0 | 114,106.1 | 116,668.9 | 119,289.2 | 121,968.4 | 124,707.8 |
| Depreciation, % | 17.3 | 14.39 | 12.86 | 11.34 | 6.04 | 12.38 | 12.38 | 12.38 | 12.38 | 12.38 |
| EBIT | -62,011.0 | 38,048.0 | 69,684.0 | 47,712.0 | 357,487.0 | 105,245.4 | 107,609.2 | 110,026.0 | 112,497.2 | 115,023.8 |
| EBIT, % | -18.4 | 9.59 | 16.26 | 9.99 | 39.67 | 11.42 | 11.42 | 11.42 | 11.42 | 11.42 |
| Total Cash | 28,816.0 | 87,487.0 | 25,988.0 | 32,996.0 | 285,277.0 | 138,621.4 | 141,734.8 | 144,918.1 | 148,172.9 | 151,500.8 |
| Total Cash, percent | .0 | .0 | .0 | .0 | .0 | .0 | .0 | .0 | .0 | .0 |
| Account Receivables | 58,086.0 | 22,336.0 | 29,896.0 | 33,361.0 | 31,238.0 | 74,244.2 | 75,911.7 | 77,616.7 | 79,359.9 | 81,142.3 |
| Account Receivables, % | 17.23 | 5.63 | 6.98 | 6.99 | 3.47 | 8.06 | 8.06 | 8.06 | 8.06 | 8.06 |
| Inventories | 13,453.0 | 10,452.0 | 9,744.0 | 9,842.0 | 12,557.0 | 22,763.8 | 23,275.0 | 23,797.8 | 24,332.3 | 24,878.8 |
| Inventories, % | 3.99 | 2.63 | 2.27 | 2.06 | 1.39 | 2.47 | 2.47 | 2.47 | 2.47 | 2.47 |
| Accounts Payable | 22,799.0 | 12,809.0 | 17,566.0 | 20,065.0 | 19,810.0 | 37,759.2 | 38,607.3 | 39,474.4 | 40,361.0 | 41,267.5 |
| Accounts Payable, % | 6.76 | 3.23 | 4.1 | 4.2 | 2.2 | 4.1 | 4.1 | 4.1 | 4.1 | 4.1 |
| Capital Expenditure | -78,886.0 | -62,050.0 | -56,945.0 | -70,381.0 | -107,958.0 | -145,661.2 | -148,932.7 | -152,277.7 | -155,697.8 | -159,194.7 |
| Capital Expenditure, % | -23.4 | -15.64 | -13.29 | -14.74 | -11.98 | -15.81 | -15.81 | -15.81 | -15.81 | -15.81 |
| Tax Rate, % | 26.19 | 26.19 | 26.19 | 26.19 | 26.19 | 26.19 | 26.19 | 26.19 | 26.19 | 26.19 |
| EBITAT | -62,296.2 | 13,950.4 | 63,775.4 | 29,507.7 | 263,845.9 | 76,584.4 | 78,304.4 | 80,063.1 | 81,861.3 | 83,699.9 |
| Depreciation | ||||||||||
| Changes in Account Receivables | ||||||||||
| Changes in Inventories | ||||||||||
| Changes in Accounts Payable | ||||||||||
| Capital Expenditure | ||||||||||
| UFCF | -131,595.2 | 37,749.4 | 59,827.4 | 12,218.7 | 209,430.9 | 9,765.5 | 44,709.9 | 45,714.1 | 46,740.8 | 47,790.6 |
| WACC, % | 4.97 | 4.3 | 4.88 | 4.57 | 4.69 | 4.68 | 4.68 | 4.68 | 4.68 | 4.68 |
| PV UFCF | ||||||||||
| SUM PV UFCF | 166,920.3 | |||||||||
| Long Term Growth Rate, % | 1.00 | |||||||||
| Free cash flow (T + 1) | 48,269 | |||||||||
| Terminal Value | 1,310,968 | |||||||||
| Present Terminal Value | 1,042,879 | |||||||||
| Enterprise Value | 1,209,800 | |||||||||
| Net Debt | 429,881 | |||||||||
| Equity Value | 779,919 | |||||||||
| Diluted Shares Outstanding, MM | 286 | |||||||||
| Equity Value Per Share | 2,723.76 |
What You Will Receive
- Customizable Excel Template: An Excel-based DCF Calculator tailored for Seibu Holdings Inc. with pre-filled financial data.
- Accurate Market Data: Access to historical performance and future projections (highlighted in the yellow cells).
- Flexible Forecasting: Adjust key assumptions such as revenue growth, EBITDA %, and WACC.
- Instant Calculations: Quickly assess how your inputs influence the valuation of Seibu Holdings Inc. (9024T).
- Professional Resource: Designed for investors, CFOs, consultants, and financial analysts.
- User-Centric Layout: Organized for clarity and straightforward navigation, complete with step-by-step guidance.
Key Features
- 🔍 Real-Life SEIBU Financials: Pre-filled historical and projected data for Seibu Holdings Inc. (9024T).
- ✏️ Fully Customizable Inputs: Adjust all essential parameters (yellow cells) such as WACC, growth %, and tax rates.
- 📊 Professional DCF Valuation: Integrated formulas to determine Seibu's intrinsic value using the Discounted Cash Flow method.
- ⚡ Instant Results: Visualize Seibu's valuation immediately after making any adjustments.
- Scenario Analysis: Analyze and compare results for different financial assumptions side by side.
How It Works
- Download: Obtain the pre-configured Excel file containing Seibu Holdings Inc.'s financial data.
- Customize: Modify forecasts such as revenue growth, EBITDA %, and WACC to fit your analysis.
- Update Automatically: Real-time updates for intrinsic value and NPV calculations as adjustments are made.
- Test Scenarios: Generate various projections and compare results instantly for deeper insights.
- Make Decisions: Leverage the valuation outcomes to inform your investment strategy for Seibu Holdings Inc. (9024T).
Why Choose the Seibu Holdings Inc. (9024T) Calculator?
- Efficiency at Its Best: Skip the hassle of building a DCF model from the ground up – it's ready for immediate use.
- Enhanced Precision: Dependable financial data and proven formulas minimize valuation errors.
- Completely Customizable: Adjust the model to align with your specific assumptions and forecasts.
- User-Friendly Insights: Intuitive charts and outputs make it simple to interpret the results.
- Preferred by Industry Professionals: Crafted for experts who prioritize accuracy and ease of use.
Who Should Benefit from Seibu Holdings Inc. (9024T)?
- Institutional Investors: Create comprehensive and trustworthy valuation models for portfolio evaluation.
- Corporate Finance Departments: Assess valuation scenarios to inform strategic decisions.
- Financial Consultants and Advisors: Deliver precise valuation insights for Seibu Holdings Inc. (9024T) to clients.
- Students and Instructors: Utilize real market data to learn and teach financial modeling techniques.
- Industry Enthusiasts: Gain insights into how companies like Seibu Holdings Inc. (9024T) are valued in the marketplace.
Contents of the Template
- Pre-Filled Data: Contains Seibu Holdings Inc.'s historical financials and projections.
- Discounted Cash Flow Model: An editable DCF valuation model featuring automatic calculations.
- Weighted Average Cost of Capital (WACC): A specific sheet for WACC calculation based on user-defined inputs.
- Key Financial Ratios: Assess Seibu's profitability, operational efficiency, and capital structure.
- Customizable Inputs: Easily modify revenue growth rates, profit margins, and tax percentages.
- Comprehensive Dashboard: Visuals and tables that highlight essential valuation outcomes.
Disclaimer
All information, articles, and product details provided on this website are for general informational and educational purposes only. We do not claim any ownership over, nor do we intend to infringe upon, any trademarks, copyrights, logos, brand names, or other intellectual property mentioned or depicted on this site. Such intellectual property remains the property of its respective owners, and any references here are made solely for identification or informational purposes, without implying any affiliation, endorsement, or partnership.
We make no representations or warranties, express or implied, regarding the accuracy, completeness, or suitability of any content or products presented. Nothing on this website should be construed as legal, tax, investment, financial, medical, or other professional advice. In addition, no part of this site—including articles or product references—constitutes a solicitation, recommendation, endorsement, advertisement, or offer to buy or sell any securities, franchises, or other financial instruments, particularly in jurisdictions where such activity would be unlawful.
All content is of a general nature and may not address the specific circumstances of any individual or entity. It is not a substitute for professional advice or services. Any actions you take based on the information provided here are strictly at your own risk. You accept full responsibility for any decisions or outcomes arising from your use of this website and agree to release us from any liability in connection with your use of, or reliance upon, the content or products found herein.