
|
Kintetsu Group Holdings Co., Ltd. (9041.t) valoración de DCF |
Completamente Editable: Adáptelo A Sus Necesidades En Excel O Sheets
Diseño Profesional: Plantillas Confiables Y Estándares De La Industria
Predeterminadas Para Un Uso Rápido Y Eficiente
Compatible con MAC / PC, completamente desbloqueado
No Se Necesita Experiencia; Fáciles De Seguir
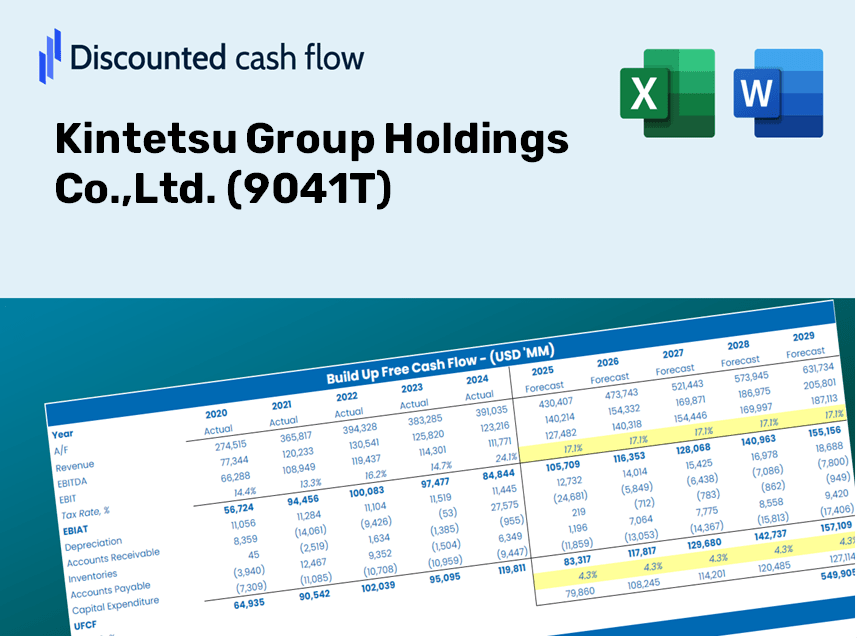
Kintetsu Group Holdings Co.,Ltd. (9041.T) Bundle
¿Busca determinar el valor intrínseco de Kintetsu Group Holdings Co., Ltd.? Nuestra calculadora DCF (9041T) integra datos del mundo real con extensas características de personalización, lo que le permite refinar sus pronósticos y mejorar su toma de decisiones de inversión.
Discounted Cash Flow (DCF) - (USD MM)
| Year | AY1 2020 |
AY2 2021 |
AY3 2022 |
AY4 2023 |
AY5 2024 |
FY1 2025 |
FY2 2026 |
FY3 2027 |
FY4 2028 |
FY5 2029 |
|---|---|---|---|---|---|---|---|---|---|---|
| Revenue | 697,203.0 | 691,512.0 | 1,561,002.0 | 1,629,529.0 | 1,741,787.0 | 2,222,793.1 | 2,836,632.1 | 3,619,987.0 | 4,619,670.4 | 5,895,423.2 |
| Revenue Growth, % | 0 | -0.81626 | 125.74 | 4.39 | 6.89 | 27.62 | 27.62 | 27.62 | 27.62 | 27.62 |
| EBITDA | -20,852.0 | 55,142.0 | 133,207.0 | 164,122.0 | 176,591.0 | 149,936.2 | 191,342.1 | 244,182.5 | 311,615.1 | 397,669.7 |
| EBITDA, % | -2.99 | 7.97 | 8.53 | 10.07 | 10.14 | 6.75 | 6.75 | 6.75 | 6.75 | 6.75 |
| Depreciation | 54,788.0 | 51,277.0 | 66,061.0 | 76,824.0 | 82,440.0 | 128,713.0 | 164,257.9 | 209,618.8 | 267,506.4 | 341,380.1 |
| Depreciation, % | 7.86 | 7.42 | 4.23 | 4.71 | 4.73 | 5.79 | 5.79 | 5.79 | 5.79 | 5.79 |
| EBIT | -75,640.0 | 3,865.0 | 67,146.0 | 87,298.0 | 94,151.0 | 21,223.2 | 27,084.2 | 34,563.7 | 44,108.6 | 56,289.5 |
| EBIT, % | -10.85 | 0.55892 | 4.3 | 5.36 | 5.41 | 0.9548 | 0.9548 | 0.9548 | 0.9548 | 0.9548 |
| Total Cash | 76,972.0 | 78,902.0 | 222,095.0 | 272,559.0 | 265,692.0 | 305,225.7 | 389,515.8 | 497,083.1 | 634,355.9 | 809,537.5 |
| Total Cash, percent | .0 | .0 | .0 | .0 | .0 | .0 | .0 | .0 | .0 | .0 |
| Account Receivables | 45,131.0 | 60,104.0 | 223,073.0 | 183,967.0 | 192,262.0 | 230,205.7 | 293,778.6 | 374,907.5 | 478,440.7 | 610,565.2 |
| Account Receivables, % | 6.47 | 8.69 | 14.29 | 11.29 | 11.04 | 10.36 | 10.36 | 10.36 | 10.36 | 10.36 |
| Inventories | 16,855.0 | 18,541.0 | 19,564.0 | 190,722.0 | 222,589.0 | 137,081.9 | 174,938.0 | 223,248.3 | 284,899.7 | 363,576.7 |
| Inventories, % | 2.42 | 2.68 | 1.25 | 11.7 | 12.78 | 6.17 | 6.17 | 6.17 | 6.17 | 6.17 |
| Accounts Payable | 39,879.0 | 49,084.0 | 133,461.0 | 122,435.0 | 117,651.0 | 158,421.8 | 202,171.1 | 258,002.0 | 329,250.9 | 420,175.8 |
| Accounts Payable, % | 5.72 | 7.1 | 8.55 | 7.51 | 6.75 | 7.13 | 7.13 | 7.13 | 7.13 | 7.13 |
| Capital Expenditure | -54,649.0 | -33,180.0 | -32,508.0 | -56,754.0 | -86,367.0 | -102,961.5 | -131,395.0 | -167,680.6 | -213,986.7 | -273,080.5 |
| Capital Expenditure, % | -7.84 | -4.8 | -2.08 | -3.48 | -4.96 | -4.63 | -4.63 | -4.63 | -4.63 | -4.63 |
| Tax Rate, % | 43.31 | 43.31 | 43.31 | 43.31 | 43.31 | 43.31 | 43.31 | 43.31 | 43.31 | 43.31 |
| EBITAT | -54,518.2 | 3,169.4 | 55,772.2 | 54,448.6 | 53,374.2 | 15,119.5 | 19,294.9 | 24,623.3 | 31,423.1 | 40,100.8 |
| Depreciation | ||||||||||
| Changes in Account Receivables | ||||||||||
| Changes in Inventories | ||||||||||
| Changes in Accounts Payable | ||||||||||
| Capital Expenditure | ||||||||||
| UFCF | -76,486.2 | 13,812.4 | 9,710.2 | -68,559.4 | 4,501.2 | 129,205.2 | -5,521.9 | -7,046.8 | -8,992.8 | -11,476.3 |
| WACC, % | 3.3 | 3.56 | 3.59 | 3.05 | 2.89 | 3.28 | 3.28 | 3.28 | 3.28 | 3.28 |
| PV UFCF | ||||||||||
| SUM PV UFCF | 95,858.9 | |||||||||
| Long Term Growth Rate, % | 2.00 | |||||||||
| Free cash flow (T + 1) | -11,706 | |||||||||
| Terminal Value | -914,777 | |||||||||
| Present Terminal Value | -778,470 | |||||||||
| Enterprise Value | -682,611 | |||||||||
| Net Debt | 1,070,704 | |||||||||
| Equity Value | -1,753,315 | |||||||||
| Diluted Shares Outstanding, MM | 190 | |||||||||
| Equity Value Per Share | -9,219.48 |
What You Will Receive
- Authentic Kintetsu Group Financial Data: Pre-loaded with Kintetsu Group's historical and forecasted data for accurate analysis.
- Completely Customizable Template: Effortlessly adjust key metrics such as revenue growth, WACC, and EBITDA percentage.
- Instant Calculations: Monitor Kintetsu Group's intrinsic value update in real-time based on your inputs.
- Professional Valuation Resource: Tailored for investors, analysts, and consultants seeking reliable DCF analyses.
- Intuitive Interface: Streamlined design and straightforward guidance suitable for all experience levels.
Primary Advantages
- Authentic Kintetsu Financials: Gain access to precise pre-loaded historical figures and future forecasts.
- Adjustable Forecast Inputs: Modify the yellow-highlighted cells, including WACC, growth rates, and profit margins.
- Real-Time Calculations: Experience automatic updates to DCF, Net Present Value (NPV), and cash flow assessments.
- Visual Analytics Dashboard: Intuitive charts and summaries to help interpret your valuation results.
- Designed for All Levels: A user-friendly framework tailored for investors, CFOs, and consultants.
How It Functions
- Step 1: Download the Excel file.
- Step 2: Examine Kintetsu Group Holdings Co., Ltd.'s pre-filled financial data and projections.
- Step 3: Adjust key inputs such as revenue growth, WACC, and tax rates (highlighted cells).
- Step 4: Observe the DCF model update in real-time as you modify assumptions.
- Step 5: Evaluate the outputs and leverage the results for investment decisions regarding Kintetsu Group Holdings Co., Ltd. (9041T).
Why Opt for Kintetsu Group Holdings Co., Ltd. Calculator?
- Precision: Leverages authentic Kintetsu financial data to ensure accurate results.
- Versatility: Crafted for users to experiment and adjust inputs as needed.
- Efficiency: Eliminate the burden of creating a DCF model from the ground up.
- Expert-Level: Engineered with the meticulousness and functionality required by top executives.
- Intuitive: Simple enough for anyone, regardless of their financial modeling background.
Who Can Benefit from This Product?
- Professional Investors: Create comprehensive and trustworthy valuation models for analyzing portfolios related to Kintetsu Group Holdings Co., Ltd. (9041T).
- Corporate Finance Teams: Evaluate valuation scenarios to inform strategic decisions within the organization.
- Consultants and Advisors: Deliver precise valuation insights regarding Kintetsu Group Holdings Co., Ltd. (9041T) to clients.
- Students and Educators: Utilize real-world data for hands-on practice and teaching in financial modeling.
- Transportation Industry Enthusiasts: Gain insights into how companies like Kintetsu Group Holdings Co., Ltd. (9041T) are valued in the market.
Contents of the Template
- Historical Data: Features Kintetsu Group Holdings' past financials and foundational forecasts.
- DCF and Levered DCF Models: Comprehensive templates for calculating the intrinsic value of Kintetsu Group Holdings (9041T).
- WACC Sheet: Includes pre-calculated values for Weighted Average Cost of Capital.
- Editable Inputs: Adjust critical parameters such as growth rates, EBITDA percentages, and CAPEX projections.
- Quarterly and Annual Statements: A detailed overview of Kintetsu Group Holdings' financial performance.
- Interactive Dashboard: A dynamic tool to visualize valuation outcomes and forecasts.
Disclaimer
All information, articles, and product details provided on this website are for general informational and educational purposes only. We do not claim any ownership over, nor do we intend to infringe upon, any trademarks, copyrights, logos, brand names, or other intellectual property mentioned or depicted on this site. Such intellectual property remains the property of its respective owners, and any references here are made solely for identification or informational purposes, without implying any affiliation, endorsement, or partnership.
We make no representations or warranties, express or implied, regarding the accuracy, completeness, or suitability of any content or products presented. Nothing on this website should be construed as legal, tax, investment, financial, medical, or other professional advice. In addition, no part of this site—including articles or product references—constitutes a solicitation, recommendation, endorsement, advertisement, or offer to buy or sell any securities, franchises, or other financial instruments, particularly in jurisdictions where such activity would be unlawful.
All content is of a general nature and may not address the specific circumstances of any individual or entity. It is not a substitute for professional advice or services. Any actions you take based on the information provided here are strictly at your own risk. You accept full responsibility for any decisions or outcomes arising from your use of this website and agree to release us from any liability in connection with your use of, or reliance upon, the content or products found herein.