
|
Sumitomo Warehouse Co., Ltd. (9303.T) Valoración de DCF |
Completamente Editable: Adáptelo A Sus Necesidades En Excel O Sheets
Diseño Profesional: Plantillas Confiables Y Estándares De La Industria
Predeterminadas Para Un Uso Rápido Y Eficiente
Compatible con MAC / PC, completamente desbloqueado
No Se Necesita Experiencia; Fáciles De Seguir
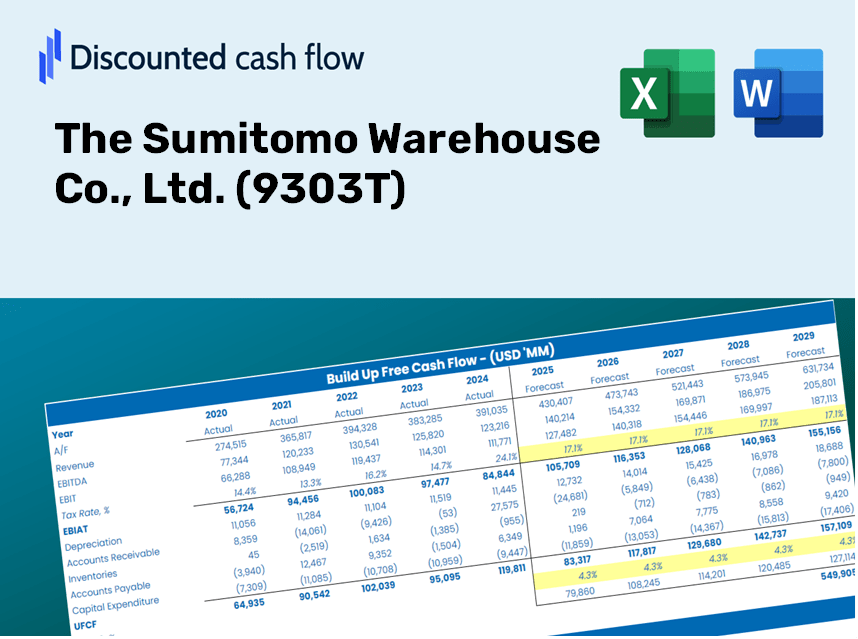
The Sumitomo Warehouse Co., Ltd. (9303.T) Bundle
¡Mejore su estrategia de inversión con la calculadora DCF (9303T)! Utilice datos financieros auténticos de almacén Sumitomo, ajuste las predicciones y gastos de crecimiento, y observe instantáneamente cómo estas modificaciones afectan el valor intrínseco de (9303T).
What You Will Receive
- Authentic 9303T Financial Data: Pre-loaded with The Sumitomo Warehouse Co., Ltd.'s historical and future data for accurate analysis.
- Customizable Template: Easily adjust essential inputs such as revenue growth, WACC, and EBITDA percentage.
- Instant Calculations: Watch as the intrinsic value of The Sumitomo Warehouse Co., Ltd. updates automatically with your modifications.
- Professional Valuation Tool: Created for investors, analysts, and consultants aiming for precise DCF outcomes.
- Intuitive User Interface: Clear layout and straightforward instructions suitable for all skill levels.
Key Features
- Comprehensive Financial Data: Gain access to precise historical figures and future estimates for The Sumitomo Warehouse Co., Ltd. (9303T).
- Adjustable Forecast Parameters: Modify highlighted cells for assumptions such as WACC, growth rates, and profit margins.
- Automated Calculations: Instant updates to DCF, Net Present Value (NPV), and cash flow evaluations.
- User-Friendly Dashboard: Clear charts and summaries designed to help you interpret your valuation outcomes.
- Suitable for All Levels: An intuitive layout tailored for investors, CFOs, and consultants, whether novice or expert.
How It Works
- Step 1: Download the Excel file.
- Step 2: Examine the pre-filled data for The Sumitomo Warehouse Co., Ltd. (9303T), including historical and projected figures.
- Step 3: Modify key assumptions (highlighted in yellow) according to your analysis.
- Step 4: Observe the automatic updates for The Sumitomo Warehouse Co., Ltd.'s (9303T) intrinsic value.
- Step 5: Utilize the results to inform your investment strategies or reports.
Why Opt for This Calculator?
- All-in-One Solution: Combines DCF, WACC, and financial ratio assessments for comprehensive analysis.
- Flexible Inputs: Modify the yellow-highlighted fields to explore different scenarios.
- In-Depth Analysis: Automatically computes the intrinsic value and Net Present Value for The Sumitomo Warehouse Co., Ltd. (9303T).
- Pre-Existing Data: Features historical and projected data to provide reliable foundations for analysis.
- Expert Standard: Perfect for financial analysts, investors, and business consultants in the industry.
Who Can Benefit from Our Services?
- Logistics Students: Discover supply chain management principles and apply them with practical examples.
- Researchers: Integrate advanced logistics models into your academic projects or studies.
- Investment Analysts: Evaluate your strategies and assess the performance metrics of The Sumitomo Warehouse Co., Ltd. (9303T).
- Supply Chain Professionals: Enhance your efficiency with our tailored logistics solutions and frameworks.
- Entrepreneurs: Understand how large logistics companies like The Sumitomo Warehouse Co., Ltd. (9303T) operate and make decisions.
What the Template Offers
- Pre-Filled DCF Model: Sumitomo Warehouse's financial data preloaded for immediate access.
- WACC Calculator: Comprehensive calculations for the Weighted Average Cost of Capital.
- Financial Ratios: Assess Sumitomo Warehouse's profitability, leverage, and operational efficiency.
- Editable Inputs: Modify assumptions such as growth rates, margins, and capital expenditures to suit your analysis.
- Financial Statements: Access annual and quarterly reports to facilitate in-depth examination.
- Interactive Dashboard: Effortlessly visualize key valuation metrics and outcomes.
Disclaimer
All information, articles, and product details provided on this website are for general informational and educational purposes only. We do not claim any ownership over, nor do we intend to infringe upon, any trademarks, copyrights, logos, brand names, or other intellectual property mentioned or depicted on this site. Such intellectual property remains the property of its respective owners, and any references here are made solely for identification or informational purposes, without implying any affiliation, endorsement, or partnership.
We make no representations or warranties, express or implied, regarding the accuracy, completeness, or suitability of any content or products presented. Nothing on this website should be construed as legal, tax, investment, financial, medical, or other professional advice. In addition, no part of this site—including articles or product references—constitutes a solicitation, recommendation, endorsement, advertisement, or offer to buy or sell any securities, franchises, or other financial instruments, particularly in jurisdictions where such activity would be unlawful.
All content is of a general nature and may not address the specific circumstances of any individual or entity. It is not a substitute for professional advice or services. Any actions you take based on the information provided here are strictly at your own risk. You accept full responsibility for any decisions or outcomes arising from your use of this website and agree to release us from any liability in connection with your use of, or reliance upon, the content or products found herein.