
|
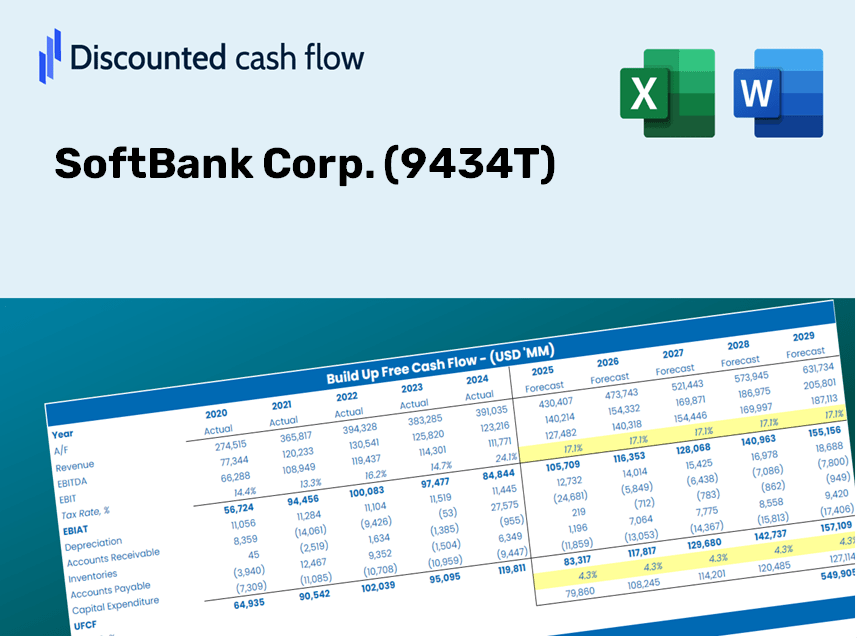
Softbank Corp. (9434.T) Valoración de DCF |
Completamente Editable: Adáptelo A Sus Necesidades En Excel O Sheets
Diseño Profesional: Plantillas Confiables Y Estándares De La Industria
Predeterminadas Para Un Uso Rápido Y Eficiente
Compatible con MAC / PC, completamente desbloqueado
No Se Necesita Experiencia; Fáciles De Seguir
SoftBank Corp. (9434.T) Bundle
¿Busca evaluar el valor intrínseco de Softbank Corp.? Nuestra calculadora DCF (9434T) integra datos del mundo real junto con extensas funciones de personalización, lo que le permite refinar sus pronósticos y mejorar sus opciones de inversión.
Benefits You Will Receive
- Comprehensive 9434T Financials: Access to both historical and projected data for precise valuation.
- Customizable Parameters: Adjust WACC, tax rates, revenue growth, and capital expenditures as needed.
- Real-Time Calculations: Intrinsic value and NPV are calculated automatically in real-time.
- Scenario Analysis: Explore various scenarios to assess SoftBank’s future performance.
- User-Friendly Design: Crafted for industry professionals while remaining accessible to newcomers.
Key Features
- Pre-Loaded Financial Data: Access SoftBank Corp.'s (9434T) historical financial reports and pre-filled forecasts.
- Customizable Inputs: Modify WACC, tax rates, revenue growth, and EBITDA margins as needed.
- Real-Time Results: View the recalculated intrinsic value of SoftBank Corp. (9434T) instantly.
- Visual Insight: Interactive dashboard charts showcase valuation results and essential metrics.
- Designed for Precision: A professional-grade tool tailored for analysts, investors, and financial professionals.
How It Works
- Step 1: Download the Excel file.
- Step 2: Review SoftBank Corp.'s (9434T) pre-filled financial data and forecasts.
- Step 3: Modify key inputs such as revenue growth, WACC, and tax rates (highlighted cells).
- Step 4: Observe the DCF model update in real-time as you adjust your assumptions.
- Step 5: Analyze the results and leverage the outputs for your investment decisions.
Why Choose This Calculator?
- Designed for Experts: A sophisticated tool tailored for analysts, CFOs, and consultants.
- Accurate Financial Insights: SoftBank Corp.'s historical and projected financial data preloaded for precision.
- Versatile Scenario Analysis: Effortlessly simulate various forecasts and assumptions.
- Comprehensive Outputs: Instantly calculates intrinsic value, NPV, and essential metrics.
- User-Friendly: Step-by-step guidance ensures a smooth calculation process.
Who Can Benefit from This Product?
- Individual Investors: Gain insights to make well-informed decisions regarding SoftBank Corp. (9434T) stock transactions.
- Financial Analysts: Enhance valuation processes with comprehensive, ready-made financial models tailored for SoftBank Corp. (9434T).
- Consultants: Provide swift and accurate valuation insights to clients focused on SoftBank Corp. (9434T).
- Business Owners: Learn about the valuation of significant companies like SoftBank Corp. (9434T) to refine your own business strategies.
- Finance Students: Develop valuation skills through the analysis of real-life data and scenarios related to SoftBank Corp. (9434T).
Contents of the Template
- Historical Data: Contains SoftBank Corp.'s past financial performance and foundational forecasts.
- DCF and Levered DCF Models: Comprehensive templates for assessing SoftBank Corp.'s intrinsic value.
- WACC Sheet: Built-in calculations for the Weighted Average Cost of Capital.
- Editable Inputs: Adjust crucial variables such as growth rates, EBITDA percentages, and CAPEX projections.
- Quarterly and Annual Statements: An exhaustive overview of SoftBank Corp.'s financial data.
- Interactive Dashboard: Dynamically visualize valuation outcomes and forecasts.
Disclaimer
All information, articles, and product details provided on this website are for general informational and educational purposes only. We do not claim any ownership over, nor do we intend to infringe upon, any trademarks, copyrights, logos, brand names, or other intellectual property mentioned or depicted on this site. Such intellectual property remains the property of its respective owners, and any references here are made solely for identification or informational purposes, without implying any affiliation, endorsement, or partnership.
We make no representations or warranties, express or implied, regarding the accuracy, completeness, or suitability of any content or products presented. Nothing on this website should be construed as legal, tax, investment, financial, medical, or other professional advice. In addition, no part of this site—including articles or product references—constitutes a solicitation, recommendation, endorsement, advertisement, or offer to buy or sell any securities, franchises, or other financial instruments, particularly in jurisdictions where such activity would be unlawful.
All content is of a general nature and may not address the specific circumstances of any individual or entity. It is not a substitute for professional advice or services. Any actions you take based on the information provided here are strictly at your own risk. You accept full responsibility for any decisions or outcomes arising from your use of this website and agree to release us from any liability in connection with your use of, or reliance upon, the content or products found herein.