
|
Kadokawa Corporation (9468.T) DCF Valoración |
Completamente Editable: Adáptelo A Sus Necesidades En Excel O Sheets
Diseño Profesional: Plantillas Confiables Y Estándares De La Industria
Predeterminadas Para Un Uso Rápido Y Eficiente
Compatible con MAC / PC, completamente desbloqueado
No Se Necesita Experiencia; Fáciles De Seguir
Kadokawa Corporation (9468.T) Bundle
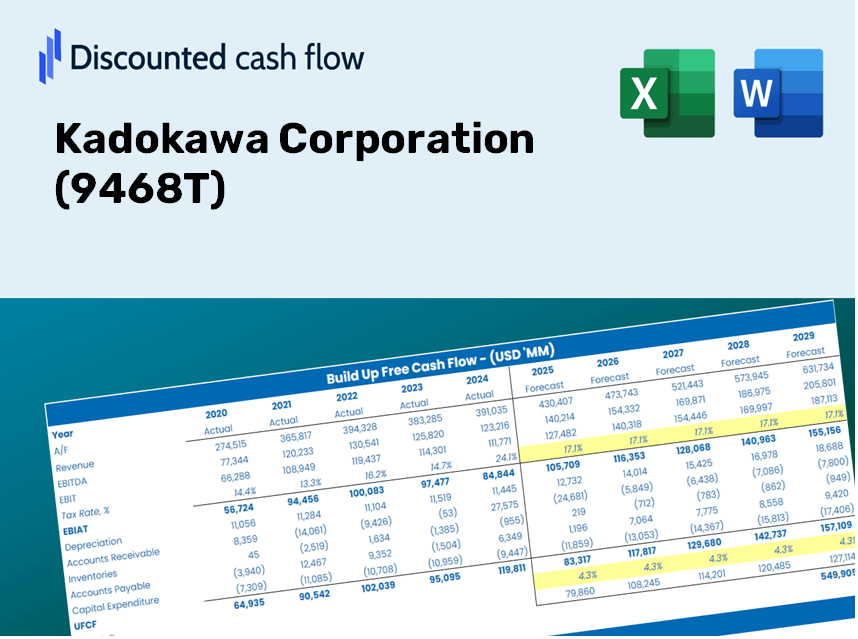
¡Mejore sus opciones de inversión con la calculadora DCF (9468T)! Revise los auténticos financieros de Kadokawa Corporation, ajuste las proyecciones y gastos de crecimiento, y observe instantáneamente cómo estos cambios influyen en el valor intrínseco de (9468T).
Discounted Cash Flow (DCF) - (USD MM)
| Year | AY1 2021 |
AY2 2022 |
AY3 2023 |
AY4 2024 |
AY5 2025 |
FY1 2026 |
FY2 2027 |
FY3 2028 |
FY4 2029 |
FY5 2030 |
|---|---|---|---|---|---|---|---|---|---|---|
| Revenue | 209,947.0 | 221,208.0 | 255,429.0 | 258,109.0 | 277,915.0 | 298,450.5 | 320,503.4 | 344,185.8 | 369,618.1 | 396,929.7 |
| Revenue Growth, % | 0 | 5.36 | 15.47 | 1.05 | 7.67 | 7.39 | 7.39 | 7.39 | 7.39 | 7.39 |
| EBITDA | 18,155.0 | 25,660.0 | 27,603.0 | 26,676.0 | 25,526.0 | 30,187.6 | 32,418.2 | 34,813.6 | 37,386.0 | 40,148.5 |
| EBITDA, % | 8.65 | 11.6 | 10.81 | 10.34 | 9.18 | 10.11 | 10.11 | 10.11 | 10.11 | 10.11 |
| Depreciation | 4,529.0 | 6,102.0 | 6,128.0 | 6,919.0 | 8,255.0 | 7,739.3 | 8,311.2 | 8,925.3 | 9,584.8 | 10,293.0 |
| Depreciation, % | 2.16 | 2.76 | 2.4 | 2.68 | 2.97 | 2.59 | 2.59 | 2.59 | 2.59 | 2.59 |
| EBIT | 13,626.0 | 19,558.0 | 21,475.0 | 19,757.0 | 17,271.0 | 22,448.3 | 24,107.0 | 25,888.3 | 27,801.3 | 29,855.5 |
| EBIT, % | 6.49 | 8.84 | 8.41 | 7.65 | 6.21 | 7.52 | 7.52 | 7.52 | 7.52 | 7.52 |
| Total Cash | 79,042.0 | 123,931.0 | 167,219.0 | 105,351.0 | 146,302.0 | 150,776.2 | 161,917.2 | 173,881.5 | 186,729.8 | 200,527.5 |
| Total Cash, percent | .0 | .0 | .0 | .0 | .0 | .0 | .0 | .0 | .0 | .0 |
| Account Receivables | 41,849.0 | 43,195.0 | 50,452.0 | 64,987.0 | 71,045.0 | 65,631.4 | 70,481.0 | 75,688.9 | 81,281.7 | 87,287.7 |
| Account Receivables, % | 19.93 | 19.53 | 19.75 | 25.18 | 25.56 | 21.99 | 21.99 | 21.99 | 21.99 | 21.99 |
| Inventories | 20,757.0 | 23,921.0 | 25,587.0 | 30,537.0 | 34,757.0 | 32,862.5 | 35,290.8 | 37,898.5 | 40,698.8 | 43,706.1 |
| Inventories, % | 9.89 | 10.81 | 10.02 | 11.83 | 12.51 | 11.01 | 11.01 | 11.01 | 11.01 | 11.01 |
| Accounts Payable | 25,266.0 | 26,635.0 | 26,635.0 | 34,084.0 | 35,411.0 | 36,082.5 | 38,748.6 | 41,611.8 | 44,686.6 | 47,988.5 |
| Accounts Payable, % | 12.03 | 12.04 | 10.43 | 13.21 | 12.74 | 12.09 | 12.09 | 12.09 | 12.09 | 12.09 |
| Capital Expenditure | -20,289.0 | -5,254.0 | -7,068.0 | -8,952.0 | -6,639.0 | -12,333.9 | -13,245.3 | -14,224.0 | -15,275.0 | -16,403.7 |
| Capital Expenditure, % | -9.66 | -2.38 | -2.77 | -3.47 | -2.39 | -4.13 | -4.13 | -4.13 | -4.13 | -4.13 |
| Tax Rate, % | 57 | 57 | 57 | 57 | 57 | 57 | 57 | 57 | 57 | 57 |
| EBITAT | 9,160.5 | 14,150.4 | 12,752.0 | 11,420.4 | 7,427.0 | 13,458.5 | 14,453.0 | 15,520.9 | 16,667.8 | 17,899.4 |
| Depreciation | ||||||||||
| Changes in Account Receivables | ||||||||||
| Changes in Inventories | ||||||||||
| Changes in Accounts Payable | ||||||||||
| Capital Expenditure | ||||||||||
| UFCF | -43,939.5 | 11,857.4 | 2,889.0 | -2,648.6 | 92.0 | 16,843.4 | 4,907.2 | 5,269.7 | 5,659.1 | 6,077.3 |
| WACC, % | 4.88 | 4.89 | 4.87 | 4.86 | 4.84 | 4.87 | 4.87 | 4.87 | 4.87 | 4.87 |
| PV UFCF | ||||||||||
| SUM PV UFCF | 34,564.3 | |||||||||
| Long Term Growth Rate, % | 2.80 | |||||||||
| Free cash flow (T + 1) | 6,247 | |||||||||
| Terminal Value | 302,131 | |||||||||
| Present Terminal Value | 238,224 | |||||||||
| Enterprise Value | 272,788 | |||||||||
| Net Debt | -118,805 | |||||||||
| Equity Value | 391,593 | |||||||||
| Diluted Shares Outstanding, MM | 137 | |||||||||
| Equity Value Per Share | 2,853.42 |
Benefits You Will Receive
- Pre-Loaded Financial Model: Kadokawa Corporation's (9468T) actual data facilitates accurate DCF valuations.
- Comprehensive Forecast Control: Modify revenue growth, profit margins, WACC, and other critical factors.
- Real-Time Calculations: Updates occur automatically, allowing you to see results instantly as you make adjustments.
- Professional-Grade Template: A polished Excel file crafted for high-quality valuation processes.
- Flexible and Reusable: Designed for adaptability, making it suitable for multiple detailed forecasts.
Key Features
- Customizable Forecast Settings: Adjust vital factors such as revenue growth, EBITDA %, and capital investments.
- Instant DCF Valuation: Quickly computes intrinsic value, NPV, and other financial metrics.
- High-Precision Accuracy: Employs Kadokawa Corporation's real financial data for dependable valuation results.
- Simplified Scenario Analysis: Effortlessly explore various assumptions and assess outcomes.
- Efficiency Booster: Avoid the hassle of constructing intricate valuation models from the ground up.
How It Functions
- Download: Obtain the pre-prepared Excel file containing Kadokawa Corporation’s (9468T) financial information.
- Customize: Modify forecasts, such as revenue growth, EBITDA margin, and WACC.
- Update Automatically: Real-time updates for intrinsic value and NPV calculations.
- Test Scenarios: Generate various projections and analyze different outcomes immediately.
- Make Decisions: Leverage the valuation insights to inform your investment approach.
Why Opt for This Calculator?
- All-in-One Solution: Integrates DCF, WACC, and financial ratio assessments seamlessly.
- Flexible Inputs: Modify the yellow-highlighted cells to explore different scenarios.
- In-Depth Analysis: Automatically computes Kadokawa Corporation’s intrinsic value and Net Present Value.
- Data-Ready: Comes with historical and projected data for reliable baselines.
- High-Caliber Tool: Perfect for financial analysts, investors, and business advisors.
Who Should Utilize This Product?
- Individual Investors: Make well-informed choices about buying or selling Kadokawa Corporation (9468T) stock.
- Financial Analysts: Enhance valuation workflows with comprehensive financial models tailored for Kadokawa Corporation (9468T).
- Consultants: Provide clients with accurate and timely valuation insights regarding Kadokawa Corporation (9468T).
- Business Owners: Gain an understanding of how major companies like Kadokawa Corporation (9468T) are valued to inform your strategic decisions.
- Finance Students: Explore valuation methodologies through real-world data and case studies related to Kadokawa Corporation (9468T).
Contents of the Template
- Comprehensive DCF Model: An editable template featuring thorough valuation calculations.
- Real-World Data: Historical and projected financials of Kadokawa Corporation (9468T) preloaded for analysis.
- Customizable Parameters: Modify WACC, growth rates, and tax assumptions to simulate various scenarios.
- Financial Statements: Complete annual and quarterly breakdowns for more profound insights.
- Key Ratios: Integrated analysis for assessing profitability, efficiency, and leverage.
- Dashboard with Visual Outputs: Charts and tables designed for clear and actionable results.
Disclaimer
All information, articles, and product details provided on this website are for general informational and educational purposes only. We do not claim any ownership over, nor do we intend to infringe upon, any trademarks, copyrights, logos, brand names, or other intellectual property mentioned or depicted on this site. Such intellectual property remains the property of its respective owners, and any references here are made solely for identification or informational purposes, without implying any affiliation, endorsement, or partnership.
We make no representations or warranties, express or implied, regarding the accuracy, completeness, or suitability of any content or products presented. Nothing on this website should be construed as legal, tax, investment, financial, medical, or other professional advice. In addition, no part of this site—including articles or product references—constitutes a solicitation, recommendation, endorsement, advertisement, or offer to buy or sell any securities, franchises, or other financial instruments, particularly in jurisdictions where such activity would be unlawful.
All content is of a general nature and may not address the specific circumstances of any individual or entity. It is not a substitute for professional advice or services. Any actions you take based on the information provided here are strictly at your own risk. You accept full responsibility for any decisions or outcomes arising from your use of this website and agree to release us from any liability in connection with your use of, or reliance upon, the content or products found herein.