
|
Shikoku Electric Power Company, Incorporated (9507.T) Valoración de DCF |
Completamente Editable: Adáptelo A Sus Necesidades En Excel O Sheets
Diseño Profesional: Plantillas Confiables Y Estándares De La Industria
Predeterminadas Para Un Uso Rápido Y Eficiente
Compatible con MAC / PC, completamente desbloqueado
No Se Necesita Experiencia; Fáciles De Seguir
Shikoku Electric Power Company, Incorporated (9507.T) Bundle
¡Evalúe las perspectivas financieras de Shikoku Electric Power Company, incorporado como un experto! Esta calculadora DCF (9507T) proporciona datos financieros preconsados y ofrece una flexibilidad total para modificar el crecimiento de los ingresos, WACC, los márgenes y otros supuestos esenciales para alinearse con sus predicciones.
Benefits of Using Our Model
- Edit Forecast Parameters: Easily modify key assumptions (growth %, margins, WACC) to explore various scenarios.
- Incorporated Market Data: Shikoku Electric Power Company’s financial data pre-populated to enhance your analysis.
- Automated DCF Calculations: The template computes Net Present Value (NPV) and intrinsic value automatically.
- Tailored and Professional Design: A sophisticated Excel model that adjusts to meet your valuation requirements.
- Designed for Analysts and Investors: Perfect for assessing forecasts, validating strategies, and streamlining your workflow.
Key Features
- Accurate Financial Data for Shikoku Electric (9507T): Gain access to reliable historical data and future forecasts.
- Customizable Assumptions: Modify highlighted cells for parameters like WACC, growth rates, and profit margins.
- Real-Time Calculations: Automatic refreshing of DCF, Net Present Value (NPV), and cash flow metrics.
- Interactive Dashboard: Clear visuals and summaries to help you interpret your valuation outcomes.
- Designed for All Skill Levels: User-friendly layout tailored for investors, CFOs, and consultants alike.
How It Functions
- 1. Access the Template: Download and open the Excel file containing Shikoku Electric Power Company’s (9507T) preloaded data.
- 2. Modify Assumptions: Adjust key inputs such as growth rates, WACC, and capital expenditures.
- 3. See Results Immediately: The DCF model automatically computes intrinsic value and NPV.
- 4. Explore Scenarios: Evaluate various forecasts to understand different valuation possibilities.
- 5. Present with Assurance: Deliver professional valuation insights to back your decisions.
Why Opt for This Calculator?
- Precision: Utilize authentic Shikoku Electric Power Company financials for reliable data.
- Versatility: Tailored for users to effortlessly experiment with and adjust inputs.
- Efficiency: Eliminate the need to create a DCF model from the ground up.
- Expert-Level: Crafted with the precision and functionality expected by CFOs.
- Intuitive: Simple to navigate, even for individuals lacking advanced financial modeling skills.
Who Can Benefit from This Product?
- Individual Investors: Gain insights for making educated decisions regarding the purchase or sale of Shikoku Electric Power Company's stock (9507T).
- Financial Analysts: Enhance valuation processes with accessible financial models tailored for Shikoku Electric Power Company (9507T).
- Consultants: Provide clients with precise and quick valuation insights related to Shikoku Electric Power Company (9507T).
- Business Owners: Learn from the valuation practices of major companies like Shikoku Electric Power Company (9507T) to shape your own business strategies.
- Finance Students: Acquire knowledge of valuation techniques through the analysis of real-world data and case studies centered around Shikoku Electric Power Company (9507T).
Contents of the Template
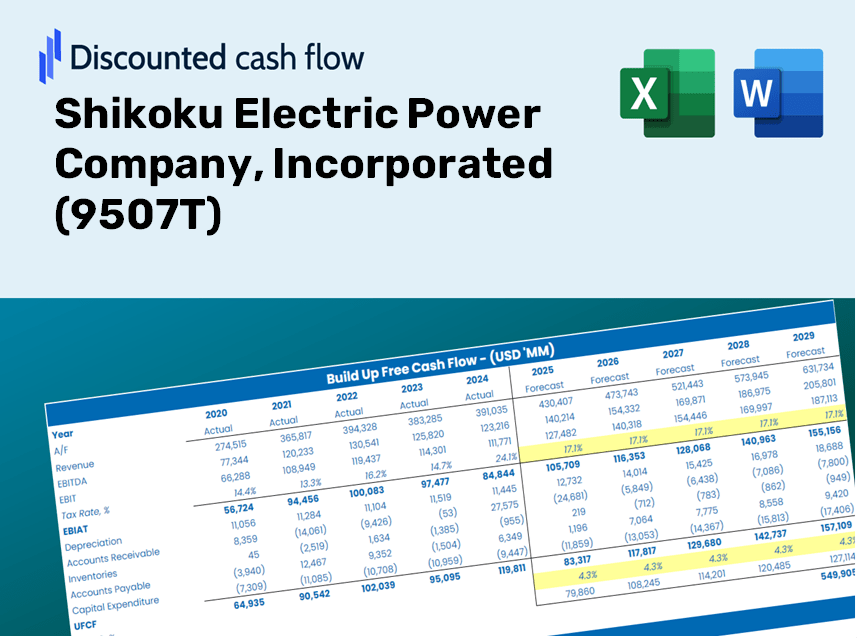
- Preloaded 9507T Data: Historical and forecasted financial information, including revenue, EBIT, and capital expenditures.
- DCF and WACC Models: High-quality spreadsheets designed for calculating intrinsic value and Weighted Average Cost of Capital.
- Editable Inputs: Cells highlighted in yellow for modifying revenue growth, tax rates, and discount rates.
- Financial Statements: Detailed annual and quarterly financials for in-depth analysis.
- Key Ratios: Metrics on profitability, leverage, and efficiency to assess performance.
- Dashboard and Charts: Visual representations of valuation results and underlying assumptions.
Disclaimer
All information, articles, and product details provided on this website are for general informational and educational purposes only. We do not claim any ownership over, nor do we intend to infringe upon, any trademarks, copyrights, logos, brand names, or other intellectual property mentioned or depicted on this site. Such intellectual property remains the property of its respective owners, and any references here are made solely for identification or informational purposes, without implying any affiliation, endorsement, or partnership.
We make no representations or warranties, express or implied, regarding the accuracy, completeness, or suitability of any content or products presented. Nothing on this website should be construed as legal, tax, investment, financial, medical, or other professional advice. In addition, no part of this site—including articles or product references—constitutes a solicitation, recommendation, endorsement, advertisement, or offer to buy or sell any securities, franchises, or other financial instruments, particularly in jurisdictions where such activity would be unlawful.
All content is of a general nature and may not address the specific circumstances of any individual or entity. It is not a substitute for professional advice or services. Any actions you take based on the information provided here are strictly at your own risk. You accept full responsibility for any decisions or outcomes arising from your use of this website and agree to release us from any liability in connection with your use of, or reliance upon, the content or products found herein.