
|
Kyoritsu Mantenance Co., Ltd. (9616.T) Valoración de DCF |
Completamente Editable: Adáptelo A Sus Necesidades En Excel O Sheets
Diseño Profesional: Plantillas Confiables Y Estándares De La Industria
Predeterminadas Para Un Uso Rápido Y Eficiente
Compatible con MAC / PC, completamente desbloqueado
No Se Necesita Experiencia; Fáciles De Seguir
Kyoritsu Maintenance Co., Ltd. (9616.T) Bundle
¡Explore las perspectivas financieras de Kyoritsu Maintenance Co., Ltd. (9616T) con nuestra calculadora DCF fácil de usar! Ingrese sus suposiciones para el crecimiento, los márgenes y los gastos para calcular el valor intrínseco de Kyoritsu Mantenance Co., Ltd. (9616T) y mejorar su toma de decisiones de inversión.
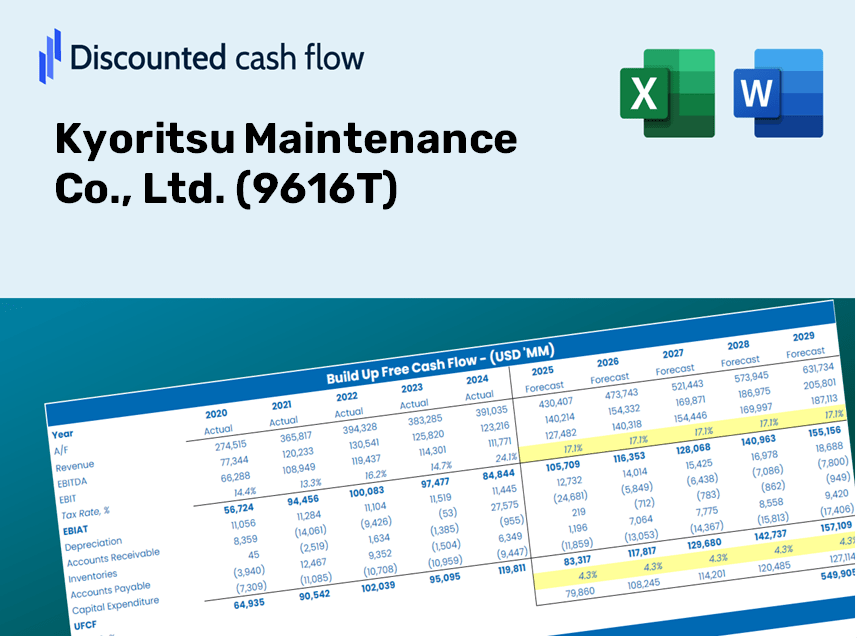
Discounted Cash Flow (DCF) - (USD MM)
| Year | AY1 2020 |
AY2 2021 |
AY3 2022 |
AY4 2023 |
AY5 2024 |
FY1 2025 |
FY2 2026 |
FY3 2027 |
FY4 2028 |
FY5 2029 |
|---|---|---|---|---|---|---|---|---|---|---|
| Revenue | 121,281.0 | 173,701.0 | 175,630.0 | 204,126.0 | 228,933.0 | 270,547.5 | 319,726.4 | 377,844.9 | 446,527.9 | 527,695.8 |
| Revenue Growth, % | 0 | 43.22 | 1.11 | 16.23 | 12.15 | 18.18 | 18.18 | 18.18 | 18.18 | 18.18 |
| EBITDA | -9,006.0 | 8,545.0 | 13,595.0 | 25,035.0 | 29,966.0 | 16,551.1 | 19,559.7 | 23,115.2 | 27,317.0 | 32,282.6 |
| EBITDA, % | -7.43 | 4.92 | 7.74 | 12.26 | 13.09 | 6.12 | 6.12 | 6.12 | 6.12 | 6.12 |
| Depreciation | 5,407.0 | 6,540.0 | 6,601.0 | 7,292.0 | 8,425.0 | 10,407.5 | 12,299.4 | 14,535.1 | 17,177.2 | 20,299.6 |
| Depreciation, % | 4.46 | 3.77 | 3.76 | 3.57 | 3.68 | 3.85 | 3.85 | 3.85 | 3.85 | 3.85 |
| EBIT | -14,413.0 | 2,005.0 | 6,994.0 | 17,743.0 | 21,541.0 | 6,143.6 | 7,260.4 | 8,580.1 | 10,139.8 | 11,982.9 |
| EBIT, % | -11.88 | 1.15 | 3.98 | 8.69 | 9.41 | 2.27 | 2.27 | 2.27 | 2.27 | 2.27 |
| Total Cash | 24,588.0 | 37,942.0 | 56,027.0 | 31,807.0 | 25,675.0 | 54,550.2 | 64,466.2 | 76,184.5 | 90,033.0 | 106,398.8 |
| Total Cash, percent | .0 | .0 | .0 | .0 | .0 | .0 | .0 | .0 | .0 | .0 |
| Account Receivables | 9,650.0 | 11,780.0 | 15,137.0 | 17,851.0 | 18,248.0 | 21,683.4 | 25,624.9 | 30,282.9 | 35,787.6 | 42,292.9 |
| Account Receivables, % | 7.96 | 6.78 | 8.62 | 8.75 | 7.97 | 8.01 | 8.01 | 8.01 | 8.01 | 8.01 |
| Inventories | 18,142.0 | 15,461.0 | 18,718.0 | 21,359.0 | 17,375.0 | 28,445.6 | 33,616.3 | 39,726.9 | 46,948.3 | 55,482.4 |
| Inventories, % | 14.96 | 8.9 | 10.66 | 10.46 | 7.59 | 10.51 | 10.51 | 10.51 | 10.51 | 10.51 |
| Accounts Payable | 4,667.0 | 6,202.0 | 7,249.0 | 9,394.0 | 9,220.0 | 10,916.8 | 12,901.3 | 15,246.4 | 18,017.8 | 21,293.0 |
| Accounts Payable, % | 3.85 | 3.57 | 4.13 | 4.6 | 4.03 | 4.04 | 4.04 | 4.04 | 4.04 | 4.04 |
| Capital Expenditure | -7,632.0 | -10,946.0 | -5,025.0 | -23,544.0 | -41,990.0 | -24,528.5 | -28,987.2 | -34,256.4 | -40,483.3 | -47,842.2 |
| Capital Expenditure, % | -6.29 | -6.3 | -2.86 | -11.53 | -18.34 | -9.07 | -9.07 | -9.07 | -9.07 | -9.07 |
| Tax Rate, % | 29.98 | 29.98 | 29.98 | 29.98 | 29.98 | 29.98 | 29.98 | 29.98 | 29.98 | 29.98 |
| EBITAT | -11,790.2 | 772.5 | 4,622.3 | 12,904.2 | 15,082.9 | 4,044.6 | 4,779.8 | 5,648.6 | 6,675.4 | 7,888.8 |
| Depreciation | ||||||||||
| Changes in Account Receivables | ||||||||||
| Changes in Inventories | ||||||||||
| Changes in Accounts Payable | ||||||||||
| Capital Expenditure | ||||||||||
| UFCF | -37,140.2 | -1,547.5 | 631.3 | -6,557.8 | -15,069.1 | -22,885.5 | -19,035.9 | -22,496.1 | -26,585.4 | -31,418.0 |
| WACC, % | 3.96 | 3.41 | 3.76 | 3.85 | 3.81 | 3.76 | 3.76 | 3.76 | 3.76 | 3.76 |
| PV UFCF | ||||||||||
| SUM PV UFCF | -108,940.4 | |||||||||
| Long Term Growth Rate, % | 2.00 | |||||||||
| Free cash flow (T + 1) | -32,046 | |||||||||
| Terminal Value | -1,822,479 | |||||||||
| Present Terminal Value | -1,515,467 | |||||||||
| Enterprise Value | -1,624,407 | |||||||||
| Net Debt | 122,949 | |||||||||
| Equity Value | -1,747,356 | |||||||||
| Diluted Shares Outstanding, MM | 91 | |||||||||
| Equity Value Per Share | -19,244.65 |
What You Will Receive
- Adjustable Forecast Parameters: Effortlessly modify assumptions (growth %, margins, WACC) to generate various scenarios.
- Industry-Specific Data: Kyoritsu Maintenance Co., Ltd.'s financial data pre-loaded to expedite your analysis.
- Automatic DCF Calculations: The template computes Net Present Value (NPV) and intrinsic value automatically for you.
- Professional and Customizable: An elegant Excel model tailored to suit your valuation requirements.
- Designed for Analysts and Investors: Perfect for testing projections, validating strategies, and enhancing efficiency.
Key Features
- Genuine Financial Data: Gain access to precise historical figures and future estimates for Kyoritsu Maintenance Co., Ltd. (9616T).
- Adjustable Forecast Parameters: Modify the highlighted cells for metrics like WACC, growth rates, and profit margins.
- Real-Time Calculations: Automatic updates for DCF, Net Present Value (NPV), and cash flow assessments.
- Interactive Dashboard: Clear and concise charts and summaries to help you understand your valuation outcomes.
- Designed for All Skill Levels: A user-friendly layout tailored for investors, CFOs, and consultants alike.
How It Works
- Step 1: Download the Excel file for Kyoritsu Maintenance Co., Ltd. (9616T).
- Step 2: Examine the pre-filled financial data and forecasts for Kyoritsu Maintenance.
- Step 3: Adjust key inputs such as revenue growth, WACC, and tax rates (marked cells).
- Step 4: Observe the DCF model update in real-time as you modify the assumptions.
- Step 5: Review the outputs and leverage the findings for your investment strategies.
Why Opt for Kyoritsu Maintenance Co., Ltd. (9616T) Calculator?
- All-in-One Solution: Features DCF, WACC, and financial ratio assessments combined in a single tool.
- Flexible Inputs: Modify the yellow-highlighted fields to explore different scenarios.
- In-Depth Analysis: Automatically computes Kyoritsu’s intrinsic value and Net Present Value.
- Ready-to-Use Data: Historical and projected data provide reliable starting figures.
- High-Quality Standards: Perfect for financial analysts, investors, and business advisors.
Who Should Use Kyoritsu Maintenance Co., Ltd. (9616T)?
- Investors: Accurately assess the fair value of Kyoritsu Maintenance Co., Ltd. (9616T) before making investment choices.
- CFOs: Utilize a professional-grade DCF model for comprehensive financial reporting and analysis.
- Consultants: Efficiently modify the template for client valuation reports related to Kyoritsu Maintenance Co., Ltd. (9616T).
- Entrepreneurs: Discover financial modeling insights employed by leading companies, including Kyoritsu Maintenance Co., Ltd. (9616T).
- Educators: Employ it as an educational resource to illustrate various valuation methodologies.
Contents of the Template
- Pre-Filled DCF Model: Kyoritsu Maintenance Co., Ltd.'s (9616T) financial data preloaded for immediate analysis.
- WACC Calculator: Comprehensive calculations for Weighted Average Cost of Capital.
- Financial Ratios: Assess Kyoritsu Maintenance's (9616T) profitability, leverage, and operational efficiency.
- Editable Inputs: Adjust assumptions like growth rates, margins, and CAPEX to tailor your scenarios.
- Financial Statements: Access annual and quarterly reports to enhance your analysis.
- Interactive Dashboard: Visualize key valuation metrics and outcomes with ease.
Disclaimer
All information, articles, and product details provided on this website are for general informational and educational purposes only. We do not claim any ownership over, nor do we intend to infringe upon, any trademarks, copyrights, logos, brand names, or other intellectual property mentioned or depicted on this site. Such intellectual property remains the property of its respective owners, and any references here are made solely for identification or informational purposes, without implying any affiliation, endorsement, or partnership.
We make no representations or warranties, express or implied, regarding the accuracy, completeness, or suitability of any content or products presented. Nothing on this website should be construed as legal, tax, investment, financial, medical, or other professional advice. In addition, no part of this site—including articles or product references—constitutes a solicitation, recommendation, endorsement, advertisement, or offer to buy or sell any securities, franchises, or other financial instruments, particularly in jurisdictions where such activity would be unlawful.
All content is of a general nature and may not address the specific circumstances of any individual or entity. It is not a substitute for professional advice or services. Any actions you take based on the information provided here are strictly at your own risk. You accept full responsibility for any decisions or outcomes arising from your use of this website and agree to release us from any liability in connection with your use of, or reliance upon, the content or products found herein.