
|
Transcosmos inc. (9715.t) valoración de DCF |
Completamente Editable: Adáptelo A Sus Necesidades En Excel O Sheets
Diseño Profesional: Plantillas Confiables Y Estándares De La Industria
Predeterminadas Para Un Uso Rápido Y Eficiente
Compatible con MAC / PC, completamente desbloqueado
No Se Necesita Experiencia; Fáciles De Seguir
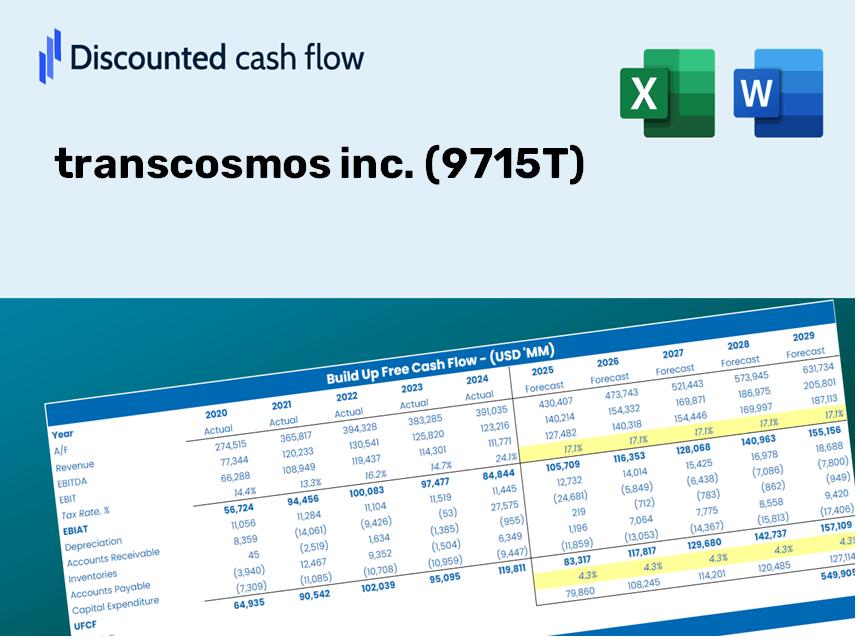
transcosmos inc. (9715.T) Bundle
¡Agilice su análisis y mejore la precisión con nuestra calculadora DCF (9715T)! Equipado con datos reales de TransCosmos Inc. y suposiciones personalizables, esta herramienta le permite pronosticar, evaluar y evaluar TransCosmos Inc. como un inversor experimentado.
Discounted Cash Flow (DCF) - (USD MM)
| Year | AY1 2021 |
AY2 2022 |
AY3 2023 |
AY4 2024 |
AY5 2025 |
FY1 2026 |
FY2 2027 |
FY3 2028 |
FY4 2029 |
FY5 2030 |
|---|---|---|---|---|---|---|---|---|---|---|
| Revenue | 336,405.0 | 354,085.0 | 373,830.0 | 362,201.0 | 375,849.0 | 386,644.5 | 397,750.1 | 409,174.7 | 420,927.5 | 433,017.8 |
| Revenue Growth, % | 0 | 5.26 | 5.58 | -3.11 | 3.77 | 2.87 | 2.87 | 2.87 | 2.87 | 2.87 |
| EBITDA | 21,900.0 | 31,483.0 | 29,029.0 | 22,423.0 | 22,045.0 | 27,237.4 | 28,019.8 | 28,824.6 | 29,652.5 | 30,504.2 |
| EBITDA, % | 6.51 | 8.89 | 7.77 | 6.19 | 5.87 | 7.04 | 7.04 | 7.04 | 7.04 | 7.04 |
| Depreciation | 4,808.0 | 5,636.0 | 5,509.0 | 5,895.0 | 6,362.0 | 6,043.1 | 6,216.7 | 6,395.3 | 6,579.0 | 6,767.9 |
| Depreciation, % | 1.43 | 1.59 | 1.47 | 1.63 | 1.69 | 1.56 | 1.56 | 1.56 | 1.56 | 1.56 |
| EBIT | 17,092.0 | 25,847.0 | 23,520.0 | 16,528.0 | 15,683.0 | 21,194.3 | 21,803.0 | 22,429.3 | 23,073.5 | 23,736.3 |
| EBIT, % | 5.08 | 7.3 | 6.29 | 4.56 | 4.17 | 5.48 | 5.48 | 5.48 | 5.48 | 5.48 |
| Total Cash | 49,903.0 | 64,834.0 | 51,176.0 | 64,844.0 | 73,502.0 | 65,183.0 | 67,055.2 | 68,981.3 | 70,962.6 | 73,000.9 |
| Total Cash, percent | .0 | .0 | .0 | .0 | .0 | .0 | .0 | .0 | .0 | .0 |
| Account Receivables | 56,143.0 | 73,434.0 | 70,688.0 | 67,332.0 | 69,369.0 | 72,212.5 | 74,286.7 | 76,420.4 | 78,615.5 | 80,873.5 |
| Account Receivables, % | 16.69 | 20.74 | 18.91 | 18.59 | 18.46 | 18.68 | 18.68 | 18.68 | 18.68 | 18.68 |
| Inventories | 7,354.0 | 5,736.0 | 5,113.0 | 4,204.0 | 3,642.0 | 5,647.7 | 5,809.9 | 5,976.8 | 6,148.4 | 6,325.0 |
| Inventories, % | 2.19 | 1.62 | 1.37 | 1.16 | 0.96901 | 1.46 | 1.46 | 1.46 | 1.46 | 1.46 |
| Accounts Payable | 13,104.0 | 16,529.0 | 16,230.0 | 13,743.0 | 14,223.0 | 15,839.6 | 16,294.6 | 16,762.6 | 17,244.1 | 17,739.4 |
| Accounts Payable, % | 3.9 | 4.67 | 4.34 | 3.79 | 3.78 | 4.1 | 4.1 | 4.1 | 4.1 | 4.1 |
| Capital Expenditure | -5,816.0 | -5,223.0 | -6,033.0 | -5,053.0 | -2,731.0 | -5,366.2 | -5,520.4 | -5,678.9 | -5,842.0 | -6,009.8 |
| Capital Expenditure, % | -1.73 | -1.48 | -1.61 | -1.4 | -0.72662 | -1.39 | -1.39 | -1.39 | -1.39 | -1.39 |
| Tax Rate, % | 27.47 | 27.47 | 27.47 | 27.47 | 27.47 | 27.47 | 27.47 | 27.47 | 27.47 | 27.47 |
| EBITAT | 9,609.3 | 17,858.5 | 15,823.5 | 10,199.4 | 11,375.5 | 13,854.1 | 14,252.0 | 14,661.4 | 15,082.5 | 15,515.7 |
| Depreciation | ||||||||||
| Changes in Account Receivables | ||||||||||
| Changes in Inventories | ||||||||||
| Changes in Accounts Payable | ||||||||||
| Capital Expenditure | ||||||||||
| UFCF | -41,791.7 | 6,023.5 | 18,369.5 | 12,819.4 | 14,011.5 | 11,298.5 | 13,167.0 | 13,545.2 | 13,934.2 | 14,334.4 |
| WACC, % | 4.27 | 4.32 | 4.31 | 4.29 | 4.33 | 4.31 | 4.31 | 4.31 | 4.31 | 4.31 |
| PV UFCF | ||||||||||
| SUM PV UFCF | 58,252.3 | |||||||||
| Long Term Growth Rate, % | 0.50 | |||||||||
| Free cash flow (T + 1) | 14,406 | |||||||||
| Terminal Value | 378,521 | |||||||||
| Present Terminal Value | 306,581 | |||||||||
| Enterprise Value | 364,834 | |||||||||
| Net Debt | -56,969 | |||||||||
| Equity Value | 421,803 | |||||||||
| Diluted Shares Outstanding, MM | 40 | |||||||||
| Equity Value Per Share | 10,559.65 |
What You Will Receive
- Flexible Forecast Inputs: Effortlessly adjust assumptions (growth %, margins, WACC) to generate various scenarios.
- Up-to-Date Data: Transcosmos Inc.'s (9715T) financial information included to kickstart your analysis.
- Instant DCF Calculations: The template automatically computes Net Present Value (NPV) and intrinsic value for you.
- Tailored and Professional: A sophisticated Excel model that can be customized to fit your valuation requirements.
- Designed for Analysts and Investors: Perfect for evaluating projections, confirming strategies, and streamlining your workflow.
Key Features
- Customizable Forecast Inputs: Adjust essential factors such as revenue growth, EBITDA percentage, and capital expenditures.
- Instant DCF Valuation: Provides immediate calculations of intrinsic value, NPV, and other key metrics.
- Precision and Reliability: Leverages transcosmos inc.'s (9715T) actual financial data for accurate valuation results.
- Effortless Scenario Analysis: Easily examine various assumptions and assess their impacts.
- Efficiency Booster: Streamline the process by avoiding the construction of intricate valuation models from the ground up.
How It Operates
- 1. Access the Template: Download and open the Excel file featuring preloaded data for transcosmos inc. (9715T).
- 2. Modify Assumptions: Adjust essential inputs such as growth rates, WACC, and capital expenditures.
- 3. Instant Result Display: The DCF model automatically calculates intrinsic value and NPV in real-time.
- 4. Explore Scenarios: Evaluate various forecasts to assess different valuation possibilities.
- 5. Use with Assurance: Deliver professional valuation insights to bolster your decision-making process.
Why Choose This Calculator for transcosmos inc. (9715T)?
- All-in-One Solution: Offers DCF, WACC, and comprehensive financial ratio analyses in a single tool.
- Flexible Inputs: Modify the yellow-highlighted cells to explore different financial scenarios.
- In-Depth Analysis: Automatically computes the intrinsic value and Net Present Value for transcosmos inc. (9715T).
- Data-Rich Platform: Features both historical and projected data for more reliable analysis.
- Expert-Level Tool: Perfectly suited for financial analysts, investors, and business advisors.
Who Should Use This Product?
- Individual Investors: Gain insights for making informed decisions on buying or selling transcosmos inc. (9715T) shares.
- Financial Analysts: Enhance valuation methodologies with accessible financial models tailored for transcosmos inc. (9715T).
- Consultants: Provide clients with precise and swift valuation analyses for transcosmos inc. (9715T).
- Business Owners: Learn about the valuation metrics of substantial companies like transcosmos inc. (9715T) to refine your own business strategies.
- Finance Students: Explore valuation methodologies by analyzing real-world data and scenarios related to transcosmos inc. (9715T).
Overview of the Template Features
- Pre-Filled Data: Contains historical financial information and projections for transcosmos inc. (9715T).
- Discounted Cash Flow Model: An editable DCF valuation model with automatic calculations included.
- Weighted Average Cost of Capital (WACC): A dedicated worksheet for calculating WACC based on user-defined inputs.
- Key Financial Ratios: Evaluate transcosmos inc.'s profitability, efficiency, and capital structure.
- Customizable Inputs: Easily modify revenue growth rates, margins, and tax rates.
- User-Friendly Dashboard: Visual displays and tables summarizing essential valuation outcomes.
Disclaimer
All information, articles, and product details provided on this website are for general informational and educational purposes only. We do not claim any ownership over, nor do we intend to infringe upon, any trademarks, copyrights, logos, brand names, or other intellectual property mentioned or depicted on this site. Such intellectual property remains the property of its respective owners, and any references here are made solely for identification or informational purposes, without implying any affiliation, endorsement, or partnership.
We make no representations or warranties, express or implied, regarding the accuracy, completeness, or suitability of any content or products presented. Nothing on this website should be construed as legal, tax, investment, financial, medical, or other professional advice. In addition, no part of this site—including articles or product references—constitutes a solicitation, recommendation, endorsement, advertisement, or offer to buy or sell any securities, franchises, or other financial instruments, particularly in jurisdictions where such activity would be unlawful.
All content is of a general nature and may not address the specific circumstances of any individual or entity. It is not a substitute for professional advice or services. Any actions you take based on the information provided here are strictly at your own risk. You accept full responsibility for any decisions or outcomes arising from your use of this website and agree to release us from any liability in connection with your use of, or reliance upon, the content or products found herein.