
|
NSD Co., Ltd. (9759.T) Valoración de DCF |
Completamente Editable: Adáptelo A Sus Necesidades En Excel O Sheets
Diseño Profesional: Plantillas Confiables Y Estándares De La Industria
Predeterminadas Para Un Uso Rápido Y Eficiente
Compatible con MAC / PC, completamente desbloqueado
No Se Necesita Experiencia; Fáciles De Seguir
NSD Co., Ltd. (9759.T) Bundle
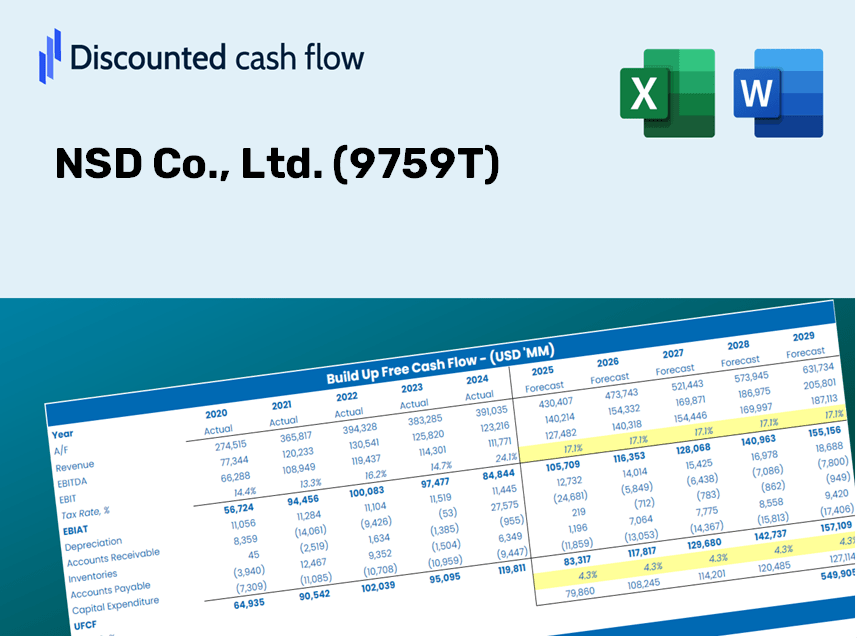
Ya sea que sea un inversionista o analista, esta calculadora DCF [9759T] es su recurso de referencia para una valoración precisa. Prelabastado con datos reales de NSD Co., Ltd., puede ajustar los pronósticos y observar los efectos en tiempo real.
Discounted Cash Flow (DCF) - (USD MM)
| Year | AY1 2020 |
AY2 2021 |
AY3 2022 |
AY4 2023 |
AY5 2024 |
FY1 2025 |
FY2 2026 |
FY3 2027 |
FY4 2028 |
FY5 2029 |
|---|---|---|---|---|---|---|---|---|---|---|
| Revenue | 66,184.3 | 71,188.1 | 77,982.2 | 101,263.0 | 107,791.0 | 122,182.4 | 138,495.2 | 156,986.0 | 177,945.4 | 201,703.3 |
| Revenue Growth, % | 0 | 7.56 | 9.54 | 29.85 | 6.45 | 13.35 | 13.35 | 13.35 | 13.35 | 13.35 |
| EBITDA | 10,160.3 | 12,353.8 | 15,599.7 | 17,969.0 | 19,726.0 | 21,688.5 | 24,584.1 | 27,866.4 | 31,586.9 | 35,804.2 |
| EBITDA, % | 15.35 | 17.35 | 20 | 17.74 | 18.3 | 17.75 | 17.75 | 17.75 | 17.75 | 17.75 |
| Depreciation | 667.2 | 741.7 | 827.1 | 2,570.0 | 2,621.0 | 1,974.5 | 2,238.1 | 2,536.9 | 2,875.6 | 3,259.6 |
| Depreciation, % | 1.01 | 1.04 | 1.06 | 2.54 | 2.43 | 1.62 | 1.62 | 1.62 | 1.62 | 1.62 |
| EBIT | 9,493.1 | 11,612.0 | 14,772.6 | 15,399.0 | 17,105.0 | 19,714.0 | 22,346.0 | 25,329.5 | 28,711.3 | 32,544.6 |
| EBIT, % | 14.34 | 16.31 | 18.94 | 15.21 | 15.87 | 16.13 | 16.13 | 16.13 | 16.13 | 16.13 |
| Total Cash | 30,086.6 | 31,820.5 | 38,366.8 | 29,420.0 | 30,358.0 | 48,035.8 | 54,449.2 | 61,718.8 | 69,959.0 | 79,299.3 |
| Total Cash, percent | .0 | .0 | .0 | .0 | .0 | .0 | .0 | .0 | .0 | .0 |
| Account Receivables | 13,330.1 | 15,777.1 | 16,115.0 | 19,397.0 | 22,737.0 | 25,222.6 | 28,590.1 | 32,407.3 | 36,734.0 | 41,638.5 |
| Account Receivables, % | 20.14 | 22.16 | 20.66 | 19.16 | 21.09 | 20.64 | 20.64 | 20.64 | 20.64 | 20.64 |
| Inventories | 203.7 | 188.5 | 204.6 | 544.0 | 622.0 | 476.3 | 539.9 | 612.0 | 693.7 | 786.3 |
| Inventories, % | 0.30776 | 0.26479 | 0.26236 | 0.53721 | 0.57704 | 0.38983 | 0.38983 | 0.38983 | 0.38983 | 0.38983 |
| Accounts Payable | 2,981.8 | 3,426.6 | 3,952.0 | 4,600.0 | 5,381.0 | 5,845.5 | 6,626.0 | 7,510.6 | 8,513.4 | 9,650.0 |
| Accounts Payable, % | 4.51 | 4.81 | 5.07 | 4.54 | 4.99 | 4.78 | 4.78 | 4.78 | 4.78 | 4.78 |
| Capital Expenditure | -560.6 | -399.0 | -330.3 | -551.0 | -589.0 | -714.0 | -809.3 | -917.3 | -1,039.8 | -1,178.6 |
| Capital Expenditure, % | -0.8471 | -0.56048 | -0.42356 | -0.54413 | -0.54643 | -0.58434 | -0.58434 | -0.58434 | -0.58434 | -0.58434 |
| Tax Rate, % | 30.94 | 30.94 | 30.94 | 30.94 | 30.94 | 30.94 | 30.94 | 30.94 | 30.94 | 30.94 |
| EBITAT | 6,382.1 | 7,830.2 | 10,224.3 | 10,278.0 | 11,812.3 | 13,392.6 | 15,180.7 | 17,207.5 | 19,504.9 | 22,109.1 |
| Depreciation | ||||||||||
| Changes in Account Receivables | ||||||||||
| Changes in Inventories | ||||||||||
| Changes in Accounts Payable | ||||||||||
| Capital Expenditure | ||||||||||
| UFCF | -4,063.4 | 6,185.8 | 10,892.6 | 9,323.6 | 11,207.3 | 12,777.8 | 13,958.9 | 15,822.6 | 17,935.1 | 20,329.6 |
| WACC, % | 4.57 | 4.57 | 4.57 | 4.57 | 4.57 | 4.57 | 4.57 | 4.57 | 4.57 | 4.57 |
| PV UFCF | ||||||||||
| SUM PV UFCF | 70,090.5 | |||||||||
| Long Term Growth Rate, % | 2.00 | |||||||||
| Free cash flow (T + 1) | 20,736 | |||||||||
| Terminal Value | 808,328 | |||||||||
| Present Terminal Value | 646,621 | |||||||||
| Enterprise Value | 716,711 | |||||||||
| Net Debt | -25,501 | |||||||||
| Equity Value | 742,212 | |||||||||
| Diluted Shares Outstanding, MM | 77 | |||||||||
| Equity Value Per Share | 9,666.02 |
What You Will Receive
- Customizable Excel Template: A fully adaptable Excel-based DCF Calculator featuring pre-populated financial data for NSD Co., Ltd. (9759T).
- Authentic Financial Insights: Access to historical data and forward-looking projections (highlighted in the yellow cells).
- Flexible Forecasting: Adjust forecast assumptions such as revenue growth rates, EBITDA percentages, and WACC.
- Instant Calculations: Quickly observe how your inputs affect NSD Co., Ltd.'s (9759T) valuation.
- Professional Resource: Designed for investors, CFOs, consultants, and financial analysts.
- Accessible Layout: Organized for simplicity and ease of navigation, complete with step-by-step guidance.
Key Features
- Customizable Forecast Inputs: Adjust essential metrics such as revenue growth, EBITDA %, and capital expenditures with ease.
- Instant DCF Valuation: Quickly computes intrinsic value, NPV, and additional financial metrics.
- High-Precision Accuracy: Utilizes NSD Co., Ltd.'s (9759T) actual financial data for reliable valuation results.
- Simplified Scenario Analysis: Effortlessly explore various assumptions and evaluate their impacts.
- Efficiency Booster: Remove the complexity of creating valuation models from the ground up.
How It Functions
- Download: Obtain the pre-prepared Excel file containing NSD Co., Ltd.'s (9759T) financial data.
- Customize: Modify forecasts such as revenue growth, EBITDA %, and WACC as per your needs.
- Real-Time Updates: The calculations for intrinsic value and NPV refresh automatically.
- Evaluate Scenarios: Generate various projections and quickly compare the results.
- Make Informed Choices: Utilize the valuation findings to influence your investment decisions.
Why Opt for NSD Co., Ltd. Calculator?
- Reliable Data: Access authentic NSD Co., Ltd. financials for dependable valuation outcomes.
- Customizable: Tailor key inputs such as growth rates, WACC, and tax rates to fit your forecasts.
- Time-Efficient: Built-in calculations save you the hassle of starting from the ground up.
- Professional Tool: Crafted for investors, analysts, and financial consultants.
- User-Friendly: Easy-to-navigate layout with clear step-by-step guidance for all users.
Who Can Benefit from NSD Co., Ltd. (9759T)?
- Finance Students: Discover valuation methodologies and practice applying them with actual data.
- Academics: Enhance your curriculum or research by integrating professional models.
- Investors: Validate your investment hypotheses and assess valuation results for NSD Co., Ltd. (9759T).
- Analysts: Optimize your analysis process with a ready-made, customizable DCF model.
- Small Business Owners: Understand the analytical approaches used for large public firms like NSD Co., Ltd. (9759T).
Contents of the Template
- Pre-Populated Information: Features NSD Co., Ltd. (9759T) historical financial data and projections.
- Discounted Cash Flow Model: An editable DCF valuation model with automated calculations.
- Weighted Average Cost of Capital (WACC): A specific sheet for determining WACC using customized inputs.
- Essential Financial Ratios: Evaluate NSD Co., Ltd. (9759T) on profitability, efficiency, and leverage.
- Adjustable Inputs: Easily modify revenue growth rates, profit margins, and tax assumptions.
- User-Friendly Dashboard: Visual representations and tables highlighting key valuation outcomes.
Disclaimer
All information, articles, and product details provided on this website are for general informational and educational purposes only. We do not claim any ownership over, nor do we intend to infringe upon, any trademarks, copyrights, logos, brand names, or other intellectual property mentioned or depicted on this site. Such intellectual property remains the property of its respective owners, and any references here are made solely for identification or informational purposes, without implying any affiliation, endorsement, or partnership.
We make no representations or warranties, express or implied, regarding the accuracy, completeness, or suitability of any content or products presented. Nothing on this website should be construed as legal, tax, investment, financial, medical, or other professional advice. In addition, no part of this site—including articles or product references—constitutes a solicitation, recommendation, endorsement, advertisement, or offer to buy or sell any securities, franchises, or other financial instruments, particularly in jurisdictions where such activity would be unlawful.
All content is of a general nature and may not address the specific circumstances of any individual or entity. It is not a substitute for professional advice or services. Any actions you take based on the information provided here are strictly at your own risk. You accept full responsibility for any decisions or outcomes arising from your use of this website and agree to release us from any liability in connection with your use of, or reliance upon, the content or products found herein.