
|
Konami Group Corporation (9766.T) Valoración de DCF |
Completamente Editable: Adáptelo A Sus Necesidades En Excel O Sheets
Diseño Profesional: Plantillas Confiables Y Estándares De La Industria
Predeterminadas Para Un Uso Rápido Y Eficiente
Compatible con MAC / PC, completamente desbloqueado
No Se Necesita Experiencia; Fáciles De Seguir
Konami Group Corporation (9766.T) Bundle
¡Evalúe las perspectivas financieras de Konami Group Corporation como un experto! Esta calculadora DCF (9766T) proporciona datos financieros preconsados junto con la flexibilidad para modificar el crecimiento de los ingresos, WACC, los márgenes y otros supuestos esenciales para alinearse con sus predicciones.
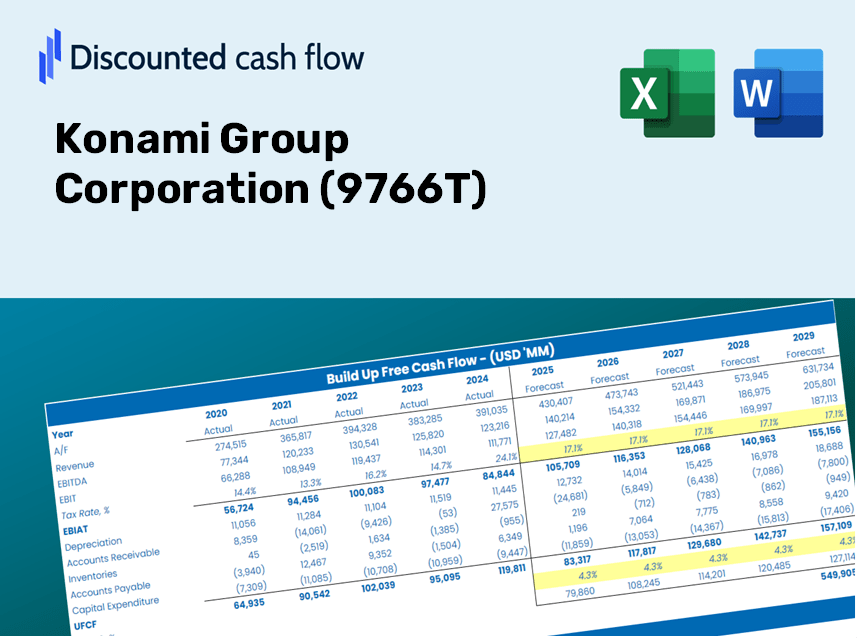
Discounted Cash Flow (DCF) - (USD MM)
| Year | AY1 2021 |
AY2 2022 |
AY3 2023 |
AY4 2024 |
AY5 2025 |
FY1 2026 |
FY2 2027 |
FY3 2028 |
FY4 2029 |
FY5 2030 |
|---|---|---|---|---|---|---|---|---|---|---|
| Revenue | 272,656.0 | 299,522.0 | 314,321.0 | 360,314.0 | 421,602.0 | 470,546.2 | 525,172.4 | 586,140.2 | 654,185.9 | 730,131.0 |
| Revenue Growth, % | 0 | 9.85 | 4.94 | 14.63 | 17.01 | 11.61 | 11.61 | 11.61 | 11.61 | 11.61 |
| EBITDA | 55,722.0 | 92,368.0 | 71,580.0 | 106,617.0 | 132,672.0 | 127,147.9 | 141,908.6 | 158,382.9 | 176,769.7 | 197,291.1 |
| EBITDA, % | 20.44 | 30.84 | 22.77 | 29.59 | 31.47 | 27.02 | 27.02 | 27.02 | 27.02 | 27.02 |
| Depreciation | 19,172.0 | 17,933.0 | 23,845.0 | 23,267.0 | 28,488.0 | 31,827.3 | 35,522.1 | 39,645.9 | 44,248.4 | 49,385.3 |
| Depreciation, % | 7.03 | 5.99 | 7.59 | 6.46 | 6.76 | 6.76 | 6.76 | 6.76 | 6.76 | 6.76 |
| EBIT | 36,550.0 | 74,435.0 | 47,735.0 | 83,350.0 | 104,184.0 | 95,320.6 | 106,386.5 | 118,737.0 | 132,521.3 | 147,905.8 |
| EBIT, % | 13.41 | 24.85 | 15.19 | 23.13 | 24.71 | 20.26 | 20.26 | 20.26 | 20.26 | 20.26 |
| Total Cash | 202,430.0 | 250,711.0 | 219,263.0 | 273,747.0 | 294,216.0 | 351,465.0 | 392,266.9 | 437,805.6 | 488,630.9 | 545,356.6 |
| Total Cash, percent | .0 | .0 | .0 | .0 | .0 | .0 | .0 | .0 | .0 | .0 |
| Account Receivables | 31,874.0 | 29,054.0 | 39,276.0 | 43,887.0 | 47,220.0 | 53,892.8 | 60,149.2 | 67,132.0 | 74,925.4 | 83,623.6 |
| Account Receivables, % | 11.69 | 9.7 | 12.5 | 12.18 | 11.2 | 11.45 | 11.45 | 11.45 | 11.45 | 11.45 |
| Inventories | 10,391.0 | 8,957.0 | 12,705.0 | 13,764.0 | 12,108.0 | 16,502.4 | 18,418.2 | 20,556.4 | 22,942.8 | 25,606.3 |
| Inventories, % | 3.81 | 2.99 | 4.04 | 3.82 | 2.87 | 3.51 | 3.51 | 3.51 | 3.51 | 3.51 |
| Accounts Payable | 32,827.0 | 33,486.0 | 37,558.0 | 44,257.0 | 45,406.0 | 54,791.6 | 61,152.4 | 68,251.6 | 76,175.0 | 85,018.2 |
| Accounts Payable, % | 12.04 | 11.18 | 11.95 | 12.28 | 10.77 | 11.64 | 11.64 | 11.64 | 11.64 | 11.64 |
| Capital Expenditure | -23,561.0 | -23,128.0 | -43,779.0 | -29,316.0 | -66,862.0 | -51,088.4 | -57,019.4 | -63,638.8 | -71,026.7 | -79,272.2 |
| Capital Expenditure, % | -8.64 | -7.72 | -13.93 | -8.14 | -15.86 | -10.86 | -10.86 | -10.86 | -10.86 | -10.86 |
| Tax Rate, % | 28.19 | 28.19 | 28.19 | 28.19 | 28.19 | 28.19 | 28.19 | 28.19 | 28.19 | 28.19 |
| EBITAT | 33,139.6 | 54,275.2 | 35,350.4 | 59,646.9 | 74,818.4 | 72,637.5 | 81,070.0 | 90,481.5 | 100,985.6 | 112,709.2 |
| Depreciation | ||||||||||
| Changes in Account Receivables | ||||||||||
| Changes in Inventories | ||||||||||
| Changes in Accounts Payable | ||||||||||
| Capital Expenditure | ||||||||||
| UFCF | 19,312.6 | 53,993.2 | 5,518.4 | 54,626.9 | 35,916.4 | 51,694.7 | 57,761.4 | 64,466.9 | 71,951.0 | 80,303.8 |
| WACC, % | 5.85 | 5.83 | 5.84 | 5.83 | 5.83 | 5.84 | 5.84 | 5.84 | 5.84 | 5.84 |
| PV UFCF | ||||||||||
| SUM PV UFCF | 272,604.7 | |||||||||
| Long Term Growth Rate, % | 3.50 | |||||||||
| Free cash flow (T + 1) | 83,114 | |||||||||
| Terminal Value | 3,556,847 | |||||||||
| Present Terminal Value | 2,678,445 | |||||||||
| Enterprise Value | 2,951,050 | |||||||||
| Net Debt | -218,689 | |||||||||
| Equity Value | 3,169,739 | |||||||||
| Diluted Shares Outstanding, MM | 136 | |||||||||
| Equity Value Per Share | 23,383.07 |
Benefits of Choosing Us
- Comprehensive Financial Model: Leverage Konami Group Corporation’s (9766T) real data for accurate DCF valuation.
- Complete Forecast Flexibility: Modify revenue growth, profit margins, WACC, and other critical factors.
- Real-Time Calculations: Updates happen instantly, providing immediate feedback as you adjust inputs.
- Professional-Grade Template: An expertly crafted Excel file designed for sophisticated valuation needs.
- Adaptable and Reusable: Custom-designed for versatility, allowing multiple applications for in-depth forecasting.
Key Features
- Comprehensive DCF Calculator: Features detailed unlevered and levered DCF valuation models tailored for Konami Group Corporation (9766T).
- WACC Calculator: A pre-configured Weighted Average Cost of Capital sheet with options for customization.
- Edit-Friendly Forecast Assumptions: Easily adjust growth rates, capital expenditures, and discount rates.
- Integrated Financial Ratios: Evaluate profitability, leverage, and efficiency ratios specific to Konami Group Corporation (9766T).
- Interactive Dashboard and Charts: Visual representations that condense crucial valuation metrics for straightforward analysis.
How It Operates
- Download the Template: Gain immediate access to the Excel-based KGC DCF Calculator for Konami Group Corporation (9766T).
- Input Your Assumptions: Modify the yellow-highlighted cells for growth rates, WACC, profit margins, and additional factors.
- Instant Calculations: The model will automatically recalculate Konami’s intrinsic value.
- Test Scenarios: Explore various assumptions to see how they impact valuation outcomes.
- Analyze and Decide: Utilize the findings to inform your investment strategy or financial assessment.
Why Choose This Calculator for Konami Group Corporation (9766T)?
- User-Friendly Interface: Perfectly tailored for both novices and seasoned professionals.
- Customizable Inputs: Effortlessly adjust parameters to suit your analysis needs.
- Real-Time Valuation: Observe immediate updates to Konami's valuation as you tweak the inputs.
- Pre-Loaded Financial Data: Comes with Konami's actual financial statistics for rapid assessments.
- Relied Upon by Experts: Favored by investors and analysts for making well-informed decisions.
Who Should Use This Product?
- Individual Investors: Make well-informed decisions regarding the purchase or sale of Konami Group Corporation (9766T) stock.
- Financial Analysts: Simplify valuation tasks with easily accessible financial models tailored for Konami Group Corporation (9766T).
- Consultants: Provide clients with expert valuation insights on Konami Group Corporation (9766T) in a timely and accurate manner.
- Business Owners: Gain insights into how major companies like Konami Group Corporation (9766T) are valued to inform your own business strategy.
- Finance Students: Explore valuation methodologies using current data and practical examples related to Konami Group Corporation (9766T).
What the Template Includes
- Preloaded Konami Data: Historical and projected financial data, encompassing revenue, EBIT, and capital expenditures.
- DCF and WACC Models: High-quality sheets designed for calculating intrinsic value and Weighted Average Cost of Capital.
- Editable Inputs: Cells highlighted in yellow for customizing revenue growth, tax rates, and discount rates.
- Financial Statements: Detailed annual and quarterly financials for enhanced analysis.
- Key Ratios: Metrics for profitability, leverage, and efficiency to assess performance.
- Dashboard and Charts: Visual representations of valuation results and underlying assumptions.
Disclaimer
All information, articles, and product details provided on this website are for general informational and educational purposes only. We do not claim any ownership over, nor do we intend to infringe upon, any trademarks, copyrights, logos, brand names, or other intellectual property mentioned or depicted on this site. Such intellectual property remains the property of its respective owners, and any references here are made solely for identification or informational purposes, without implying any affiliation, endorsement, or partnership.
We make no representations or warranties, express or implied, regarding the accuracy, completeness, or suitability of any content or products presented. Nothing on this website should be construed as legal, tax, investment, financial, medical, or other professional advice. In addition, no part of this site—including articles or product references—constitutes a solicitation, recommendation, endorsement, advertisement, or offer to buy or sell any securities, franchises, or other financial instruments, particularly in jurisdictions where such activity would be unlawful.
All content is of a general nature and may not address the specific circumstances of any individual or entity. It is not a substitute for professional advice or services. Any actions you take based on the information provided here are strictly at your own risk. You accept full responsibility for any decisions or outcomes arising from your use of this website and agree to release us from any liability in connection with your use of, or reliance upon, the content or products found herein.