
|
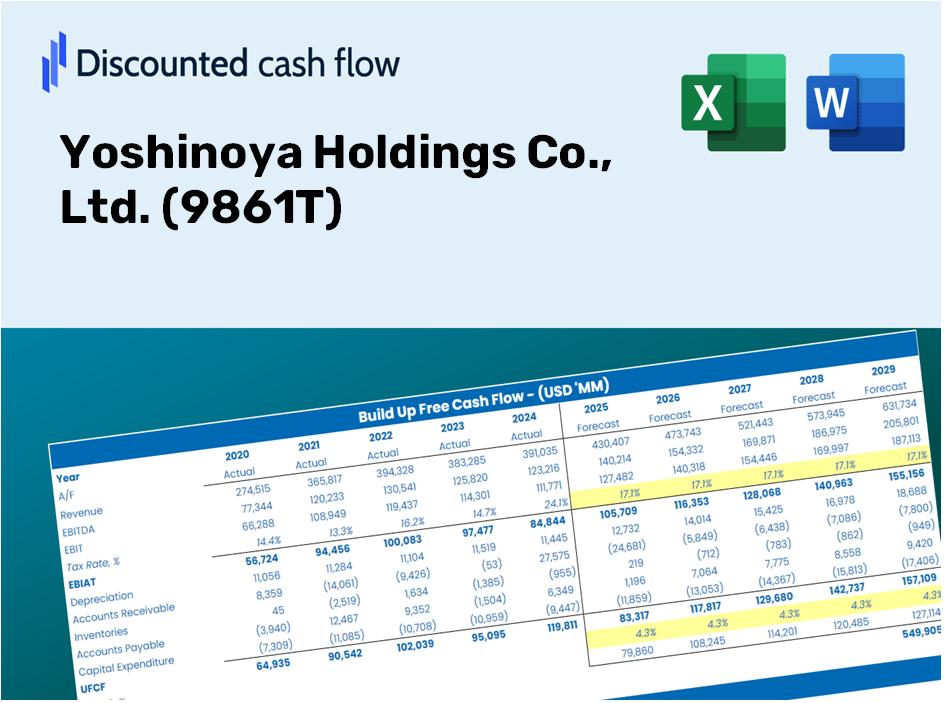
Yoshinoya Holdings Co., Ltd. (9861.T) Valoración de DCF |
Completamente Editable: Adáptelo A Sus Necesidades En Excel O Sheets
Diseño Profesional: Plantillas Confiables Y Estándares De La Industria
Predeterminadas Para Un Uso Rápido Y Eficiente
Compatible con MAC / PC, completamente desbloqueado
No Se Necesita Experiencia; Fáciles De Seguir
Yoshinoya Holdings Co., Ltd. (9861.T) Bundle
¿Busca evaluar el valor intrínseco de Yoshinoya Holdings Co., Ltd.? Nuestra calculadora DCF (9861T) integra datos del mundo real con características integrales de personalización, lo que le permite refinar sus pronósticos y tomar decisiones de inversión más informadas.
Discounted Cash Flow (DCF) - (USD MM)
| Year | AY1 2020 |
AY2 2021 |
AY3 2022 |
AY4 2023 |
AY5 2024 |
FY1 2025 |
FY2 2026 |
FY3 2027 |
FY4 2028 |
FY5 2029 |
|---|---|---|---|---|---|---|---|---|---|---|
| Revenue | 170,348.0 | 153,601.0 | 168,099.0 | 187,472.0 | 204,983.0 | 215,474.6 | 226,503.1 | 238,096.1 | 250,282.5 | 263,092.6 |
| Revenue Growth, % | 0 | -9.83 | 9.44 | 11.52 | 9.34 | 5.12 | 5.12 | 5.12 | 5.12 | 5.12 |
| EBITDA | 242.0 | 20,384.0 | 15,759.0 | 15,093.0 | 13,638.0 | 16,157.0 | 16,984.0 | 17,853.2 | 18,767.0 | 19,727.6 |
| EBITDA, % | 0.14206 | 13.27 | 9.37 | 8.05 | 6.65 | 7.5 | 7.5 | 7.5 | 7.5 | 7.5 |
| Depreciation | 7,438.0 | 6,572.0 | 6,371.0 | 6,494.0 | 6,953.0 | 8,313.4 | 8,738.9 | 9,186.2 | 9,656.4 | 10,150.6 |
| Depreciation, % | 4.37 | 4.28 | 3.79 | 3.46 | 3.39 | 3.86 | 3.86 | 3.86 | 3.86 | 3.86 |
| EBIT | -7,196.0 | 13,812.0 | 9,388.0 | 8,599.0 | 6,685.0 | 7,843.6 | 8,245.0 | 8,667.0 | 9,110.6 | 9,576.9 |
| EBIT, % | -4.22 | 8.99 | 5.58 | 4.59 | 3.26 | 3.64 | 3.64 | 3.64 | 3.64 | 3.64 |
| Total Cash | 37,900.0 | 35,179.0 | 24,234.0 | 27,346.0 | 20,571.0 | 36,281.7 | 38,138.6 | 40,090.7 | 42,142.6 | 44,299.6 |
| Total Cash, percent | .0 | .0 | .0 | .0 | .0 | .0 | .0 | .0 | .0 | .0 |
| Account Receivables | 6,374.0 | 5,655.0 | 5,965.0 | 4,865.0 | 5,603.0 | 7,024.6 | 7,384.1 | 7,762.1 | 8,159.4 | 8,577.0 |
| Account Receivables, % | 3.74 | 3.68 | 3.55 | 2.6 | 2.73 | 3.26 | 3.26 | 3.26 | 3.26 | 3.26 |
| Inventories | 7,125.0 | 6,015.0 | 7,387.0 | 7,463.0 | 7,266.0 | 8,627.0 | 9,068.5 | 9,532.7 | 10,020.6 | 10,533.5 |
| Inventories, % | 4.18 | 3.92 | 4.39 | 3.98 | 3.54 | 4 | 4 | 4 | 4 | 4 |
| Accounts Payable | 4,140.0 | 4,081.0 | 4,756.0 | 5,522.0 | 7,222.0 | 6,199.3 | 6,516.6 | 6,850.1 | 7,200.7 | 7,569.3 |
| Accounts Payable, % | 2.43 | 2.66 | 2.83 | 2.95 | 3.52 | 2.88 | 2.88 | 2.88 | 2.88 | 2.88 |
| Capital Expenditure | -4,709.0 | -3,271.0 | -6,322.0 | -9,699.0 | -13,345.0 | -8,764.9 | -9,213.5 | -9,685.1 | -10,180.8 | -10,701.9 |
| Capital Expenditure, % | -2.76 | -2.13 | -3.76 | -5.17 | -6.51 | -4.07 | -4.07 | -4.07 | -4.07 | -4.07 |
| Tax Rate, % | 40.24 | 40.24 | 40.24 | 40.24 | 40.24 | 40.24 | 40.24 | 40.24 | 40.24 | 40.24 |
| EBITAT | -6,992.8 | 8,406.9 | 7,566.9 | 5,834.0 | 3,994.8 | 5,745.4 | 6,039.5 | 6,348.6 | 6,673.5 | 7,015.1 |
| Depreciation | ||||||||||
| Changes in Account Receivables | ||||||||||
| Changes in Inventories | ||||||||||
| Changes in Accounts Payable | ||||||||||
| Capital Expenditure | ||||||||||
| UFCF | -13,622.8 | 13,477.9 | 6,608.9 | 4,419.0 | -1,238.2 | 1,488.6 | 5,081.1 | 5,341.1 | 5,614.5 | 5,901.9 |
| WACC, % | 4.52 | 4.35 | 4.45 | 4.39 | 4.35 | 4.41 | 4.41 | 4.41 | 4.41 | 4.41 |
| PV UFCF | ||||||||||
| SUM PV UFCF | 20,259.4 | |||||||||
| Long Term Growth Rate, % | 2.00 | |||||||||
| Free cash flow (T + 1) | 6,020 | |||||||||
| Terminal Value | 249,711 | |||||||||
| Present Terminal Value | 201,239 | |||||||||
| Enterprise Value | 221,499 | |||||||||
| Net Debt | 7,708 | |||||||||
| Equity Value | 213,791 | |||||||||
| Diluted Shares Outstanding, MM | 65 | |||||||||
| Equity Value Per Share | 3,304.01 |
What You Will Receive
- Pre-Filled Financial Model: Utilize actual data from Yoshinoya Holdings Co., Ltd. for accurate DCF valuation.
- Comprehensive Forecast Control: Modify revenue growth, profit margins, WACC, and other essential factors.
- Real-Time Calculations: Automatic updates provide immediate results as you adjust inputs.
- Investor-Ready Template: A polished Excel file crafted for high-quality valuation presentations.
- Customizable and Reusable: Designed for versatility, enabling repeated application for in-depth forecasts.
Key Features
- Comprehensive DCF Analysis Tool: Provides both unlevered and levered DCF valuation frameworks.
- WACC Calculator: Pre-configured Weighted Average Cost of Capital sheet with adjustable parameters.
- Customizable Forecast Inputs: Adjust growth projections, capital investments, and discount rates.
- Integrated Financial Ratios: Evaluate profitability, leverage, and efficiency ratios for Yoshinoya Holdings Co., Ltd. (9861T).
- User-Friendly Dashboard and Charts: Visual representations of key valuation data for straightforward analysis.
How It Functions
- 1. Access the Template: Download and open the Excel file featuring Yosihnoya Holdings Co., Ltd.'s preloaded data.
- 2. Modify Assumptions: Adjust critical inputs such as growth rates, WACC, and capital expenditures.
- 3. Instant Results: The DCF model automatically calculates intrinsic value and NPV.
- 4. Explore Scenarios: Evaluate different forecasts to assess various valuation results.
- 5. Present with Assurance: Share professional valuation insights to enhance your decision-making.
Why Opt for the Yoshinoya Holdings Calculator?
- Save Time: Skip the hassle of building a DCF model from the ground up – it’s immediately ready for your use.
- Enhance Accuracy: Dependable financial data and established formulas minimize valuation errors.
- Completely Customizable: Adjust the model to represent your unique assumptions and forecasts.
- Simple to Understand: Intuitive charts and outputs ensure the results are straightforward to analyze.
- Endorsed by Professionals: Crafted for experts who prioritize both precision and usability in their analyses.
Who Can Benefit from This Product?
- Investors: Assess Yoshinoya Holdings Co., Ltd.'s (9861T) valuation before making investment decisions.
- CFOs and Financial Analysts: Optimize valuation workflows and evaluate financial forecasts.
- Startup Founders: Understand how successful companies like Yoshinoya Holdings are valued.
- Consultants: Provide comprehensive valuation analyses and reports for clients.
- Students and Educators: Utilize real-time data to learn and teach valuation methodologies.
Contents of the Template
- Pre-Filled DCF Model: Yoshinoya's financial data ready for immediate analysis.
- WACC Calculator: Comprehensive calculations for Weighted Average Cost of Capital.
- Financial Ratios: Assess Yoshinoya's profitability, leverage, and operational efficiency.
- Editable Inputs: Modify assumptions such as growth rates, margins, and capital expenditures to suit your scenarios.
- Financial Statements: Access annual and quarterly reports for in-depth analysis.
- Interactive Dashboard: Visualize essential valuation metrics and outcomes effortlessly.
Disclaimer
All information, articles, and product details provided on this website are for general informational and educational purposes only. We do not claim any ownership over, nor do we intend to infringe upon, any trademarks, copyrights, logos, brand names, or other intellectual property mentioned or depicted on this site. Such intellectual property remains the property of its respective owners, and any references here are made solely for identification or informational purposes, without implying any affiliation, endorsement, or partnership.
We make no representations or warranties, express or implied, regarding the accuracy, completeness, or suitability of any content or products presented. Nothing on this website should be construed as legal, tax, investment, financial, medical, or other professional advice. In addition, no part of this site—including articles or product references—constitutes a solicitation, recommendation, endorsement, advertisement, or offer to buy or sell any securities, franchises, or other financial instruments, particularly in jurisdictions where such activity would be unlawful.
All content is of a general nature and may not address the specific circumstances of any individual or entity. It is not a substitute for professional advice or services. Any actions you take based on the information provided here are strictly at your own risk. You accept full responsibility for any decisions or outcomes arising from your use of this website and agree to release us from any liability in connection with your use of, or reliance upon, the content or products found herein.