
|
Shenzhen Hepalink Pharmaceutical Group Co., Ltd. (9989.HK) Valoración de DCF |
Completamente Editable: Adáptelo A Sus Necesidades En Excel O Sheets
Diseño Profesional: Plantillas Confiables Y Estándares De La Industria
Predeterminadas Para Un Uso Rápido Y Eficiente
Compatible con MAC / PC, completamente desbloqueado
No Se Necesita Experiencia; Fáciles De Seguir
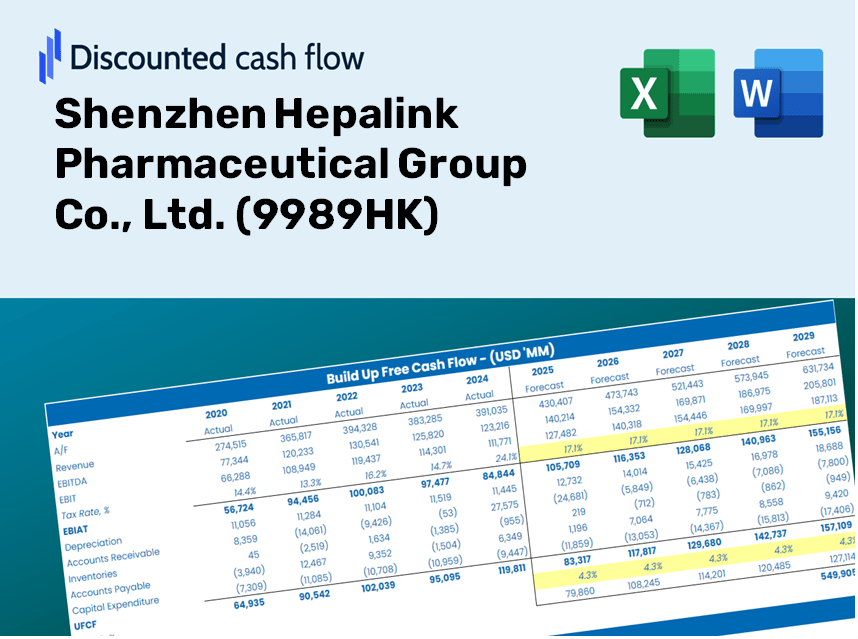
Shenzhen Hepalink Pharmaceutical Group Co., Ltd. (9989.HK) Bundle
¡Simplifique la valoración de Shenzhen Hepalink Pharmaceutical Group Co., Ltd. (9989HK) con esta calculadora DCF personalizable! Con el verdadero Shenzhen Hepalink Financials y las entradas de pronóstico ajustables, puede probar escenarios y descubrir el valor razonable de Shenzhen Hepalink en minutos.
What You Will Receive
- Adjustable Forecast Variables: Easily modify assumptions (growth %, profit margins, discount rates) to explore various scenarios.
- Industry-Specific Data: Shenzhen Hepalink Pharmaceutical Group Co., Ltd.'s financial data pre-populated to facilitate your analysis.
- Instant DCF Calculations: The template automatically computes Net Present Value (NPV) and intrinsic value for your convenience.
- Customizable and Professional Design: A sleek Excel model tailored to meet your valuation requirements.
- Designed for Analysts and Investors: Perfect for evaluating projections, confirming strategies, and enhancing efficiency.
Key Features
- Customizable Financial Inputs: Adjust essential parameters such as revenue growth, EBITDA margin, and investment expenditures.
- Instant DCF Valuation: Quickly computes intrinsic value, NPV, and other financial metrics.
- High Precision Standards: Leverages Shenzhen Hepalink's real-world financial data for accurate valuation results.
- Simplified Scenario Analysis: Effortlessly evaluate different hypotheses and assess their impacts.
- Efficiency Booster: Avoid the complexities of constructing detailed valuation models from the ground up.
How It Operates
- Download: Obtain the pre-configured Excel file containing Shenzhen Hepalink Pharmaceutical Group Co., Ltd.'s financial data.
- Customize: Modify projections for factors such as revenue growth, EBITDA percentage, and WACC.
- Update Automatically: The intrinsic value and NPV calculations refresh in real-time.
- Test Scenarios: Generate various projections and compare results immediately.
- Make Decisions: Utilize the valuation findings to inform your investment strategy.
Why Opt for Hepalink Pharmaceutical's Calculator?
- Save Time: Skip the hassle of building a DCF model from the ground up – it's ready to go.
- Enhance Precision: Utilize dependable financial data and formulas to minimize valuation errors.
- Fully Customizable: Adjust the model to match your specific assumptions and forecasts.
- Intuitive Design: User-friendly charts and outputs facilitate straightforward analysis of results.
- Endorsed by Professionals: Crafted for experts who prioritize accuracy and ease of use.
Who Can Benefit from This Product?
- Investors: Evaluate Shenzhen Hepalink Pharmaceutical Group Co., Ltd. (9989HK) and make informed stock trading decisions.
- CFOs and Financial Analysts: Optimize valuation methodologies and assess financial forecasts for the company.
- Startup Founders: Gain insights into how established pharmaceutical firms like Shenzhen Hepalink are appraised.
- Consultants: Prepare comprehensive valuation reports for clients in the pharmaceutical sector.
- Students and Educators: Utilize real-world data from Shenzhen Hepalink (9989HK) to enhance valuation skills and teaching methodologies.
Contents of the Template
- Pre-Filled Data: Contains Shenzhen Hepalink Pharmaceutical Group Co., Ltd.'s historical financial data and projections.
- Discounted Cash Flow Model: An editable DCF valuation model featuring automatic calculations.
- Weighted Average Cost of Capital (WACC): A dedicated sheet for WACC calculations tailored to your inputs.
- Key Financial Ratios: Evaluate Shenzhen Hepalink's profitability, efficiency, and financial leverage.
- Customizable Inputs: Easily adjust revenue growth rates, profit margins, and tax assumptions.
- Clear Dashboard: Visual representations and tables showcasing essential valuation outcomes.
Disclaimer
All information, articles, and product details provided on this website are for general informational and educational purposes only. We do not claim any ownership over, nor do we intend to infringe upon, any trademarks, copyrights, logos, brand names, or other intellectual property mentioned or depicted on this site. Such intellectual property remains the property of its respective owners, and any references here are made solely for identification or informational purposes, without implying any affiliation, endorsement, or partnership.
We make no representations or warranties, express or implied, regarding the accuracy, completeness, or suitability of any content or products presented. Nothing on this website should be construed as legal, tax, investment, financial, medical, or other professional advice. In addition, no part of this site—including articles or product references—constitutes a solicitation, recommendation, endorsement, advertisement, or offer to buy or sell any securities, franchises, or other financial instruments, particularly in jurisdictions where such activity would be unlawful.
All content is of a general nature and may not address the specific circumstances of any individual or entity. It is not a substitute for professional advice or services. Any actions you take based on the information provided here are strictly at your own risk. You accept full responsibility for any decisions or outcomes arising from your use of this website and agree to release us from any liability in connection with your use of, or reliance upon, the content or products found herein.