
|
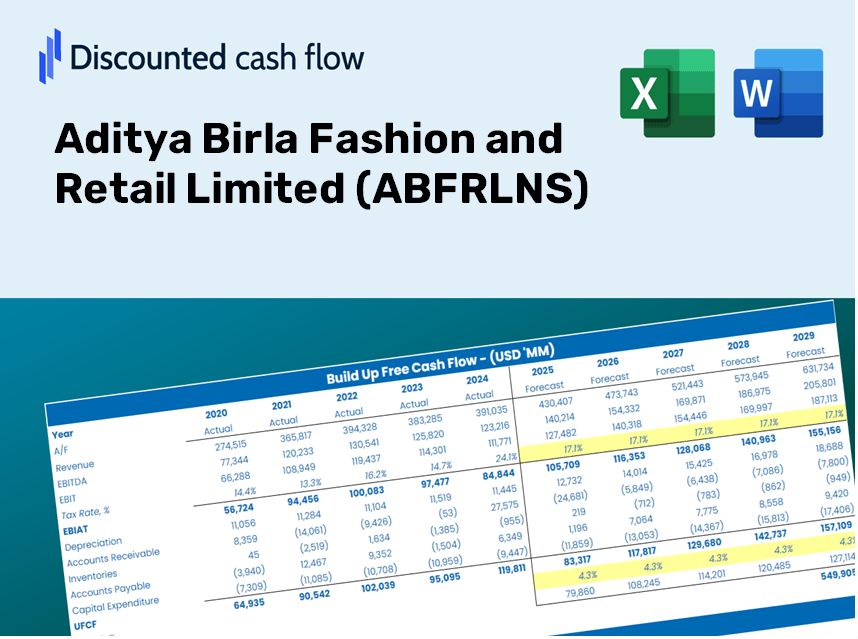
Valoración de DCF de Aditya Birla Fashion and Retail Limited (ABFRL.NS) |
Completamente Editable: Adáptelo A Sus Necesidades En Excel O Sheets
Diseño Profesional: Plantillas Confiables Y Estándares De La Industria
Predeterminadas Para Un Uso Rápido Y Eficiente
Compatible con MAC / PC, completamente desbloqueado
No Se Necesita Experiencia; Fáciles De Seguir
Aditya Birla Fashion and Retail Limited (ABFRL.NS) Bundle
Diseñada para la precisión, nuestra calculadora DCF (ABFRLNS) le permite evaluar la valoración de Aditya Birla Fashion y Retail Limited utilizando datos financieros del mundo real, proporcionando una flexibilidad completa para modificar todos los parámetros clave para las proyecciones mejoradas.
Discounted Cash Flow (DCF) - (USD MM)
| Year | AY1 2021 |
AY2 2022 |
AY3 2023 |
AY4 2024 |
AY5 2025 |
FY1 2026 |
FY2 2027 |
FY3 2028 |
FY4 2029 |
FY5 2030 |
|---|---|---|---|---|---|---|---|---|---|---|
| Revenue | 52,489.2 | 81,362.2 | 124,179.0 | 64,414.9 | 73,766.3 | 76,018.3 | 78,339.1 | 80,730.7 | 83,195.4 | 85,735.3 |
| Revenue Growth, % | 0 | 55.01 | 52.62 | -48.13 | 14.52 | 3.05 | 3.05 | 3.05 | 3.05 | 3.05 |
| EBITDA | -1,797.2 | 3,352.4 | 5,632.8 | -1,878.9 | 187.0 | 390.6 | 402.5 | 414.8 | 427.5 | 440.5 |
| EBITDA, % | -3.42 | 4.12 | 4.54 | -2.92 | 0.2535 | 0.51381 | 0.51381 | 0.51381 | 0.51381 | 0.51381 |
| Depreciation | 2,187.1 | 2,231.9 | 2,885.5 | 4,565.8 | 4,857.2 | 3,482.6 | 3,588.9 | 3,698.5 | 3,811.4 | 3,927.8 |
| Depreciation, % | 4.17 | 2.74 | 2.32 | 7.09 | 6.58 | 4.58 | 4.58 | 4.58 | 4.58 | 4.58 |
| EBIT | -3,984.3 | 1,120.5 | 2,747.3 | -6,444.7 | -4,670.2 | -3,092.0 | -3,186.4 | -3,283.7 | -3,383.9 | -3,487.2 |
| EBIT, % | -7.59 | 1.38 | 2.21 | -10 | -6.33 | -4.07 | -4.07 | -4.07 | -4.07 | -4.07 |
| Total Cash | 5,904.4 | 7,263.6 | 8,751.2 | 13,347.4 | 23,672.7 | 12,168.4 | 12,539.9 | 12,922.7 | 13,317.3 | 13,723.8 |
| Total Cash, percent | .0 | .0 | .0 | .0 | .0 | .0 | .0 | .0 | .0 | .0 |
| Account Receivables | 6,079.7 | 8,168.2 | 9,715.8 | 13,363.7 | 3,766.4 | 8,407.4 | 8,664.0 | 8,928.5 | 9,201.1 | 9,482.0 |
| Account Receivables, % | 11.58 | 10.04 | 7.82 | 20.75 | 5.11 | 11.06 | 11.06 | 11.06 | 11.06 | 11.06 |
| Inventories | 18,469.6 | 29,295.9 | 42,143.8 | 45,053.4 | 24,543.9 | 31,676.4 | 32,643.5 | 33,640.0 | 34,667.0 | 35,725.4 |
| Inventories, % | 35.19 | 36.01 | 33.94 | 69.94 | 33.27 | 41.67 | 41.67 | 41.67 | 41.67 | 41.67 |
| Accounts Payable | 21,524.2 | 34,105.6 | 38,461.2 | 41,356.6 | 22,422.9 | 31,699.4 | 32,667.1 | 33,664.4 | 34,692.2 | 35,751.3 |
| Accounts Payable, % | 41.01 | 41.92 | 30.97 | 64.2 | 30.4 | 41.7 | 41.7 | 41.7 | 41.7 | 41.7 |
| Capital Expenditure | -1,612.6 | -3,479.5 | -6,813.2 | -7,470.3 | -6,347.7 | -5,022.9 | -5,176.3 | -5,334.3 | -5,497.2 | -5,665.0 |
| Capital Expenditure, % | -3.07 | -4.28 | -5.49 | -11.6 | -8.61 | -6.61 | -6.61 | -6.61 | -6.61 | -6.61 |
| Tax Rate, % | 47.69 | 47.69 | 47.69 | 47.69 | 47.69 | 47.69 | 47.69 | 47.69 | 47.69 | 47.69 |
| EBITAT | -3,199.2 | 840.5 | 1,199.7 | -3,861.7 | -2,443.2 | -1,924.6 | -1,983.3 | -2,043.9 | -2,106.3 | -2,170.6 |
| Depreciation | ||||||||||
| Changes in Account Receivables | ||||||||||
| Changes in Inventories | ||||||||||
| Changes in Accounts Payable | ||||||||||
| Capital Expenditure | ||||||||||
| UFCF | -5,649.8 | -740.5 | -12,767.9 | -10,428.3 | 7,239.4 | -5,961.9 | -3,826.7 | -3,943.5 | -4,063.9 | -4,187.9 |
| WACC, % | 6.4 | 6.17 | 4.8 | 5.51 | 5.18 | 5.61 | 5.61 | 5.61 | 5.61 | 5.61 |
| PV UFCF | ||||||||||
| SUM PV UFCF | -18,876.9 | |||||||||
| Long Term Growth Rate, % | 4.00 | |||||||||
| Free cash flow (T + 1) | -4,355 | |||||||||
| Terminal Value | -270,009 | |||||||||
| Present Terminal Value | -205,489 | |||||||||
| Enterprise Value | -224,366 | |||||||||
| Net Debt | 42,437 | |||||||||
| Equity Value | -266,803 | |||||||||
| Diluted Shares Outstanding, MM | 1,065 | |||||||||
| Equity Value Per Share | -250.60 |
What You Will Receive
- Pre-Filled Financial Model: Utilize Aditya Birla Fashion and Retail Limited’s (ABFRLNS) actual data for accurate DCF valuation.
- Comprehensive Forecast Control: Modify revenue growth, profit margins, WACC, and other essential factors.
- Real-Time Calculations: Enjoy automatic updates that show results instantly as you adjust parameters.
- Professional-Grade Template: A polished Excel file crafted for expert valuation purposes.
- Flexible and Reusable: Designed for adaptability, enabling multiple uses for in-depth forecasting.
Key Features
- Comprehensive Historical Data: Access Aditya Birla Fashion and Retail Limited’s (ABFRLNS) past financial statements along with pre-populated forecasts.
- Customizable Inputs: Modify WACC, tax rates, revenue growth projections, and EBITDA margins as needed.
- Real-Time Valuation: Observe the recalculation of Aditya Birla Fashion and Retail Limited’s (ABFRLNS) intrinsic value instantly.
- Insightful Visual Representations: Utilize dashboard charts to visualize valuation outcomes and essential metrics.
- Designed for Precision: A robust tool tailored for analysts, investors, and financial professionals.
How It Operates
- Download: Get the pre-formatted Excel file containing Aditya Birla Fashion and Retail Limited’s (ABFRLNS) financial information.
- Customize: Modify projections, such as revenue growth, EBITDA %, and WACC.
- Update Automatically: Watch as intrinsic value and NPV calculations refresh in real-time.
- Test Scenarios: Formulate various forecasts and instantly compare the results.
- Make Decisions: Leverage the valuation findings to inform your investment approach.
Why Choose the ABFRLNS Calculator?
- Time-Saving: Skip the hassle of building a DCF model from the ground up – it’s ready for immediate use.
- Enhanced Accuracy: Dependable financial data and formulas minimize valuation errors.
- Completely Customizable: Adjust the model to align with your specific assumptions and projections.
- User-Friendly: Intuitive charts and outputs simplify data interpretation.
- Endorsed by Professionals: Crafted for experts who demand both accuracy and ease of use.
Who Can Benefit from This Product?
- Professional Investors: Create comprehensive and accurate valuation models for portfolio management related to Aditya Birla Fashion and Retail Limited (ABFRLNS).
- Corporate Finance Teams: Evaluate valuation scenarios to inform strategic decisions within their organizations.
- Consultants and Advisors: Equip clients with precise valuation insights concerning Aditya Birla Fashion and Retail Limited (ABFRLNS).
- Students and Educators: Leverage real-world data to enhance learning and practice in financial modeling.
- Fashion Industry Enthusiasts: Gain insights into how companies like Aditya Birla Fashion and Retail Limited (ABFRLNS) are valued within the market.
Contents of the Template
- Pre-Filled DCF Model: Aditya Birla Fashion and Retail Limited's (ABFRLNS) financial data preloaded for immediate application.
- WACC Calculator: Comprehensive calculations for the Weighted Average Cost of Capital.
- Financial Ratios: Assess ABFRLNS's profitability, leverage, and operational efficiency.
- Editable Inputs: Adjust assumptions such as growth, margins, and CAPEX to suit your scenarios.
- Financial Statements: Annual and quarterly reports available for in-depth analysis.
- Interactive Dashboard: Effortlessly visualize essential valuation metrics and outcomes.
Disclaimer
All information, articles, and product details provided on this website are for general informational and educational purposes only. We do not claim any ownership over, nor do we intend to infringe upon, any trademarks, copyrights, logos, brand names, or other intellectual property mentioned or depicted on this site. Such intellectual property remains the property of its respective owners, and any references here are made solely for identification or informational purposes, without implying any affiliation, endorsement, or partnership.
We make no representations or warranties, express or implied, regarding the accuracy, completeness, or suitability of any content or products presented. Nothing on this website should be construed as legal, tax, investment, financial, medical, or other professional advice. In addition, no part of this site—including articles or product references—constitutes a solicitation, recommendation, endorsement, advertisement, or offer to buy or sell any securities, franchises, or other financial instruments, particularly in jurisdictions where such activity would be unlawful.
All content is of a general nature and may not address the specific circumstances of any individual or entity. It is not a substitute for professional advice or services. Any actions you take based on the information provided here are strictly at your own risk. You accept full responsibility for any decisions or outcomes arising from your use of this website and agree to release us from any liability in connection with your use of, or reliance upon, the content or products found herein.