
|
ACC Limited (ACC.NS) DCF Valoración |
Completamente Editable: Adáptelo A Sus Necesidades En Excel O Sheets
Diseño Profesional: Plantillas Confiables Y Estándares De La Industria
Predeterminadas Para Un Uso Rápido Y Eficiente
Compatible con MAC / PC, completamente desbloqueado
No Se Necesita Experiencia; Fáciles De Seguir
ACC Limited (ACC.NS) Bundle
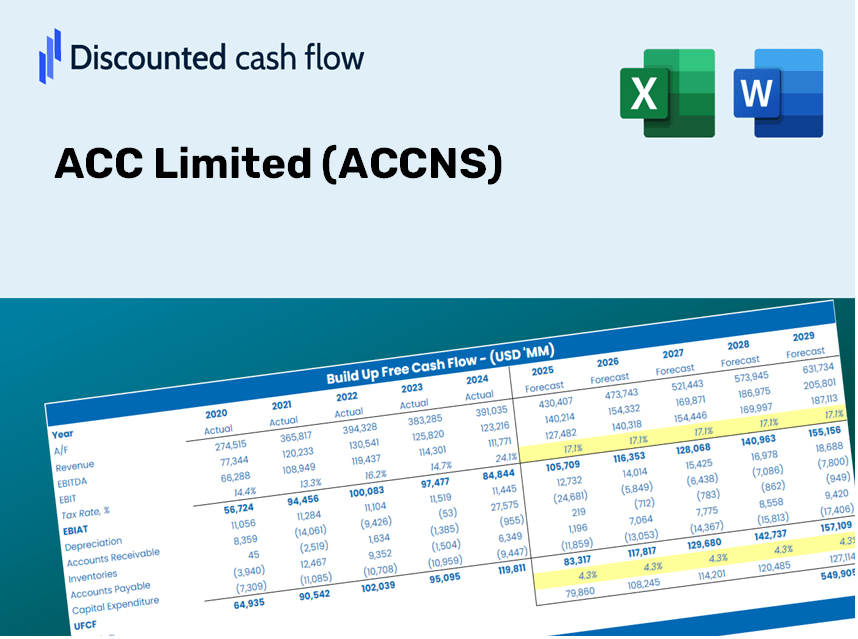
¡Evalúe las perspectivas financieras de ACC Limited como un experto! Esta calculadora ACCNS DCF viene con datos financieros previamente llenos y le permite una flexibilidad completa para modificar el crecimiento de los ingresos, WACC, los márgenes y otros supuestos cruciales para alinearse con sus proyecciones.
Discounted Cash Flow (DCF) - (USD MM)
| Year | AY1 2021 |
AY2 2022 |
AY3 2023 |
AY4 2024 |
AY5 2025 |
FY1 2026 |
FY2 2027 |
FY3 2028 |
FY4 2029 |
FY5 2030 |
|---|---|---|---|---|---|---|---|---|---|---|
| Revenue | 137,859.8 | 161,516.7 | 177,836.4 | 199,589.2 | 217,623.1 | 244,027.1 | 273,634.6 | 306,834.4 | 344,062.3 | 385,807.0 |
| Revenue Growth, % | 0 | 17.16 | 10.1 | 12.23 | 9.04 | 12.13 | 12.13 | 12.13 | 12.13 | 12.13 |
| EBITDA | 23,270.8 | 29,622.1 | 12,334.0 | 29,045.4 | 28,912.2 | 34,160.7 | 38,305.4 | 42,952.9 | 48,164.4 | 54,008.1 |
| EBITDA, % | 16.88 | 18.34 | 6.94 | 14.55 | 13.29 | 14 | 14 | 14 | 14 | 14 |
| Depreciation | 6,112.8 | 5,737.6 | 6,420.7 | 7,368.1 | 8,350.6 | 9,334.4 | 10,466.9 | 11,736.8 | 13,160.8 | 14,757.6 |
| Depreciation, % | 4.43 | 3.55 | 3.61 | 3.69 | 3.84 | 3.83 | 3.83 | 3.83 | 3.83 | 3.83 |
| EBIT | 17,158.0 | 23,884.5 | 5,913.3 | 21,677.3 | 20,561.6 | 24,826.3 | 27,838.5 | 31,216.1 | 35,003.5 | 39,250.4 |
| EBIT, % | 12.45 | 14.79 | 3.33 | 10.86 | 9.45 | 10.17 | 10.17 | 10.17 | 10.17 | 10.17 |
| Total Cash | 58,495.3 | 73,667.7 | 29,761.0 | 46,817.5 | 30,871.5 | 69,508.0 | 77,941.4 | 87,397.9 | 98,001.8 | 109,892.3 |
| Total Cash, percent | .0 | .0 | .0 | .0 | .0 | .0 | .0 | .0 | .0 | .0 |
| Account Receivables | 4,514.1 | 4,622.6 | 8,692.4 | 8,275.0 | 11,629.1 | 10,011.9 | 11,226.7 | 12,588.8 | 14,116.2 | 15,828.9 |
| Account Receivables, % | 3.27 | 2.86 | 4.89 | 4.15 | 5.34 | 4.1 | 4.1 | 4.1 | 4.1 | 4.1 |
| Inventories | 9,012.7 | 12,739.1 | 16,242.0 | 18,685.5 | 19,254.2 | 20,384.7 | 22,858.0 | 25,631.3 | 28,741.1 | 32,228.3 |
| Inventories, % | 6.54 | 7.89 | 9.13 | 9.36 | 8.85 | 8.35 | 8.35 | 8.35 | 8.35 | 8.35 |
| Accounts Payable | 14,222.3 | 19,048.9 | 16,400.7 | 18,525.5 | 16,383.0 | 23,496.2 | 26,347.0 | 29,543.6 | 33,128.1 | 37,147.5 |
| Accounts Payable, % | 10.32 | 11.79 | 9.22 | 9.28 | 7.53 | 9.63 | 9.63 | 9.63 | 9.63 | 9.63 |
| Capital Expenditure | -7,485.3 | -11,753.6 | -16,837.8 | -13,948.0 | -19,684.4 | -18,647.7 | -20,910.2 | -23,447.3 | -26,292.1 | -29,482.1 |
| Capital Expenditure, % | -5.43 | -7.28 | -9.47 | -6.99 | -9.05 | -7.64 | -7.64 | -7.64 | -7.64 | -7.64 |
| Tax Rate, % | 23.18 | 23.18 | 23.18 | 23.18 | 23.18 | 23.18 | 23.18 | 23.18 | 23.18 | 23.18 |
| EBITAT | 14,360.0 | 17,753.3 | 4,311.6 | 18,356.2 | 15,796.3 | 19,485.7 | 21,849.9 | 24,500.9 | 27,473.6 | 30,806.9 |
| Depreciation | ||||||||||
| Changes in Account Receivables | ||||||||||
| Changes in Inventories | ||||||||||
| Changes in Accounts Payable | ||||||||||
| Capital Expenditure | ||||||||||
| UFCF | 13,683.0 | 12,729.0 | -16,326.3 | 11,875.0 | -1,602.8 | 17,772.2 | 10,569.3 | 11,851.7 | 13,289.6 | 14,902.1 |
| WACC, % | 4.88 | 4.86 | 4.85 | 4.89 | 4.86 | 4.87 | 4.87 | 4.87 | 4.87 | 4.87 |
| PV UFCF | ||||||||||
| SUM PV UFCF | 59,572.9 | |||||||||
| Long Term Growth Rate, % | 4.00 | |||||||||
| Free cash flow (T + 1) | 15,498 | |||||||||
| Terminal Value | 1,785,312 | |||||||||
| Present Terminal Value | 1,407,658 | |||||||||
| Enterprise Value | 1,467,231 | |||||||||
| Net Debt | -6,209 | |||||||||
| Equity Value | 1,473,440 | |||||||||
| Diluted Shares Outstanding, MM | 188 | |||||||||
| Equity Value Per Share | 7,824.55 |
What You Will Receive
- Customizable Excel Template: A fully adaptable Excel-based DCF Calculator featuring pre-filled real ACC Limited (ACCNS) financial data.
- Authentic Data: Access to historical figures and projected estimates (highlighted in the yellow cells).
- Flexible Forecasting: Adjust forecast parameters such as revenue growth, EBITDA %, and WACC.
- Instant Calculations: Quickly gauge how your inputs influence the valuation of ACC Limited (ACCNS).
- Professional Resource: Designed for investors, CFOs, consultants, and financial analysts.
- Intuitive Layout: Organized for clarity and simplicity, complete with step-by-step guidance.
Key Features
- Customizable Forecast Inputs: Adjust essential variables such as revenue growth, EBITDA %, and capital expenditures.
- Instant DCF Valuation: Quickly computes intrinsic value, NPV, and other vital metrics.
- High-Precision Accuracy: Leverages ACC Limited’s (ACCNS) real-world financial data for credible valuation results.
- Effortless Scenario Analysis: Easily explore various assumptions and evaluate results side by side.
- Efficiency-Boosting Tool: Say goodbye to building intricate valuation models from the ground up.
How It Functions
- Download: Get the pre-built Excel file featuring ACC Limited’s financial data (ACCNS).
- Customize: Modify forecasts, including revenue growth, EBITDA %, and WACC.
- Update Instantly: The intrinsic value and NPV calculations refresh in real-time.
- Test Scenarios: Create various projections and compare results effortlessly.
- Make Informed Choices: Utilize the valuation outcomes to shape your investment strategy.
Why Choose This Calculator for ACC Limited (ACCNS)?
- Reliable Data: Access to accurate ACC Limited financials guarantees trustworthy valuation outcomes.
- Custom Tailoring: Modify essential variables such as growth rates, WACC, and tax rates to align with your forecasts.
- Efficiency Boost: Built-in calculations save you time and eliminate the hassle of starting from the ground up.
- Expert-Quality Tool: Crafted for investors, analysts, and consultants focused on ACC Limited.
- User-Friendly Design: An intuitive interface and clear instructions ensure ease of use for everyone.
Who Can Benefit from ACC Limited (ACCNS)?
- Investors: Make informed investment choices with our advanced valuation tool.
- Financial Analysts: Streamline your workflow with a customizable DCF model at your fingertips.
- Consultants: Effortlessly modify the template for effective client presentations and reports.
- Finance Enthusiasts: Expand your knowledge of valuation methods through practical, real-world case studies.
- Educators and Students: Leverage it as a hands-on resource in finance-related academic programs.
Contents of the Template
- Operating and Balance Sheet Data: Pre-filled historical data and forecasts for ACC Limited (ACCNS), covering revenue, EBITDA, EBIT, and capital expenditures.
- WACC Calculation: A dedicated sheet for computing the Weighted Average Cost of Capital (WACC), featuring parameters such as Beta, risk-free rate, and share price.
- DCF Valuation (Unlevered and Levered): Customizable Discounted Cash Flow models demonstrating intrinsic value with comprehensive calculations.
- Financial Statements: Pre-loaded financial statements (annual and quarterly) to facilitate analysis.
- Key Ratios: Includes profitability, leverage, and efficiency ratios pertinent to ACC Limited (ACCNS).
- Dashboard and Charts: Visual representations of valuation outputs and assumptions for straightforward analysis of results.
Disclaimer
All information, articles, and product details provided on this website are for general informational and educational purposes only. We do not claim any ownership over, nor do we intend to infringe upon, any trademarks, copyrights, logos, brand names, or other intellectual property mentioned or depicted on this site. Such intellectual property remains the property of its respective owners, and any references here are made solely for identification or informational purposes, without implying any affiliation, endorsement, or partnership.
We make no representations or warranties, express or implied, regarding the accuracy, completeness, or suitability of any content or products presented. Nothing on this website should be construed as legal, tax, investment, financial, medical, or other professional advice. In addition, no part of this site—including articles or product references—constitutes a solicitation, recommendation, endorsement, advertisement, or offer to buy or sell any securities, franchises, or other financial instruments, particularly in jurisdictions where such activity would be unlawful.
All content is of a general nature and may not address the specific circumstances of any individual or entity. It is not a substitute for professional advice or services. Any actions you take based on the information provided here are strictly at your own risk. You accept full responsibility for any decisions or outcomes arising from your use of this website and agree to release us from any liability in connection with your use of, or reliance upon, the content or products found herein.