
|
Valoración DCF de ACCO Brands Corporation (ACCO) |
Completamente Editable: Adáptelo A Sus Necesidades En Excel O Sheets
Diseño Profesional: Plantillas Confiables Y Estándares De La Industria
Predeterminadas Para Un Uso Rápido Y Eficiente
Compatible con MAC / PC, completamente desbloqueado
No Se Necesita Experiencia; Fáciles De Seguir
ACCO Brands Corporation (ACCO) Bundle
¡Explore el potencial financiero de ACCO Brands Corporation (ACCO) con nuestra calculadora DCF fácil de usar! Ingrese sus proyecciones para el crecimiento, los márgenes y los gastos para calcular el valor intrínseco de ACCO y refinar su enfoque de inversión.
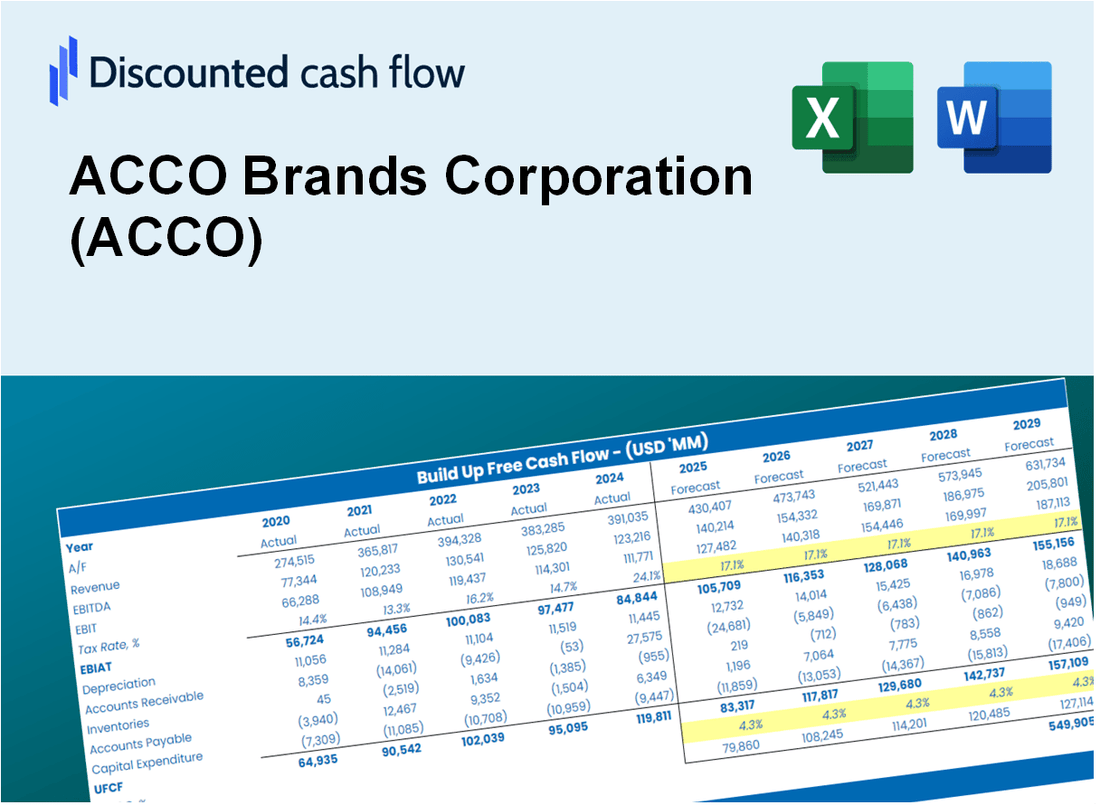
Discounted Cash Flow (DCF) - (USD MM)
| Year | AY1 2020 |
AY2 2021 |
AY3 2022 |
AY4 2023 |
AY5 2024 |
FY1 2025 |
FY2 2026 |
FY3 2027 |
FY4 2028 |
FY5 2029 |
|---|---|---|---|---|---|---|---|---|---|---|
| Revenue | 1,655.2 | 2,025.3 | 1,947.6 | 1,832.8 | 1,666.2 | 1,680.9 | 1,695.8 | 1,710.8 | 1,726.0 | 1,741.2 |
| Revenue Growth, % | 0 | 22.36 | -3.84 | -5.89 | -9.09 | 0.88475 | 0.88475 | 0.88475 | 0.88475 | 0.88475 |
| EBITDA | 188.1 | 243.4 | 139.9 | 121.6 | 38.4 | 132.8 | 134.0 | 135.2 | 136.4 | 137.6 |
| EBITDA, % | 11.36 | 12.02 | 7.18 | 6.63 | 2.3 | 7.9 | 7.9 | 7.9 | 7.9 | 7.9 |
| Depreciation | 70.7 | 85.7 | 79.4 | 76.1 | 73.1 | 71.0 | 71.6 | 72.3 | 72.9 | 73.5 |
| Depreciation, % | 4.27 | 4.23 | 4.08 | 4.15 | 4.39 | 4.22 | 4.22 | 4.22 | 4.22 | 4.22 |
| EBIT | 117.4 | 157.7 | 60.5 | 45.5 | -34.7 | 61.8 | 62.4 | 62.9 | 63.5 | 64.0 |
| EBIT, % | 7.09 | 7.79 | 3.11 | 2.48 | -2.08 | 3.68 | 3.68 | 3.68 | 3.68 | 3.68 |
| Total Cash | 36.6 | 41.2 | 62.2 | 66.4 | 74.1 | 52.1 | 52.6 | 53.1 | 53.5 | 54.0 |
| Total Cash, percent | .0 | .0 | .0 | .0 | .0 | .0 | .0 | .0 | .0 | .0 |
| Account Receivables | 356.0 | 416.1 | 384.1 | 430.7 | 348.9 | 357.1 | 360.2 | 363.4 | 366.6 | 369.9 |
| Account Receivables, % | 21.51 | 20.55 | 19.72 | 23.5 | 20.94 | 21.24 | 21.24 | 21.24 | 21.24 | 21.24 |
| Inventories | 305.1 | 428.0 | 395.2 | 327.5 | 270.4 | 315.9 | 318.7 | 321.5 | 324.3 | 327.2 |
| Inventories, % | 18.43 | 21.13 | 20.29 | 17.87 | 16.23 | 18.79 | 18.79 | 18.79 | 18.79 | 18.79 |
| Accounts Payable | 180.2 | 308.2 | 239.5 | 183.7 | 167.3 | 196.6 | 198.3 | 200.0 | 201.8 | 203.6 |
| Accounts Payable, % | 10.89 | 15.22 | 12.3 | 10.02 | 10.04 | 11.69 | 11.69 | 11.69 | 11.69 | 11.69 |
| Capital Expenditure | -15.3 | -21.2 | -16.5 | -13.8 | -15.9 | -15.2 | -15.3 | -15.5 | -15.6 | -15.8 |
| Capital Expenditure, % | -0.92436 | -1.05 | -0.8472 | -0.75295 | -0.95427 | -0.90511 | -0.90511 | -0.90511 | -0.90511 | -0.90511 |
| Tax Rate, % | -16.38 | -16.38 | -16.38 | -16.38 | -16.38 | -16.38 | -16.38 | -16.38 | -16.38 | -16.38 |
| EBITAT | 92.6 | 144.3 | -53.6 | 75.7 | -40.4 | 45.8 | 46.2 | 46.6 | 47.0 | 47.4 |
| Depreciation | ||||||||||
| Changes in Account Receivables | ||||||||||
| Changes in Inventories | ||||||||||
| Changes in Accounts Payable | ||||||||||
| Capital Expenditure | ||||||||||
| UFCF | -332.9 | 153.8 | 5.4 | 103.3 | 139.3 | 77.2 | 98.3 | 99.1 | 100.0 | 100.9 |
| WACC, % | 5.64 | 6.17 | 2.32 | 6.53 | 6.53 | 5.44 | 5.44 | 5.44 | 5.44 | 5.44 |
| PV UFCF | ||||||||||
| SUM PV UFCF | 404.5 | |||||||||
| Long Term Growth Rate, % | 2.00 | |||||||||
| Free cash flow (T + 1) | 103 | |||||||||
| Terminal Value | 2,993 | |||||||||
| Present Terminal Value | 2,296 | |||||||||
| Enterprise Value | 2,701 | |||||||||
| Net Debt | 849 | |||||||||
| Equity Value | 1,852 | |||||||||
| Diluted Shares Outstanding, MM | 96 | |||||||||
| Equity Value Per Share | 19.37 |
What You Will Get
- Real ACCO Financials: Access to historical and projected data for precise valuation.
- Customizable Inputs: Adjust WACC, tax rates, revenue growth, and capital expenditures as needed.
- Dynamic Calculations: Intrinsic value and NPV are computed in real-time.
- Scenario Analysis: Explore various scenarios to assess ACCO's future performance.
- User-Friendly Design: Designed for professionals while remaining approachable for newcomers.
Key Features
- Accurate ACCO Financials: Gain access to reliable pre-loaded historical data and forward-looking projections.
- Customizable Forecast Inputs: Modify highlighted cells for WACC, growth rates, and profit margins.
- Real-time Calculations: Automatic updates for DCF, Net Present Value (NPV), and cash flow assessments.
- Intuitive Visual Dashboard: User-friendly charts and summaries to help visualize your valuation outcomes.
- Designed for All Users: A straightforward, user-friendly layout tailored for investors, CFOs, and consultants.
How It Works
- 1. Access the Template: Download and open the Excel file containing ACCO Brands Corporation’s (ACCO) preloaded data.
- 2. Modify Assumptions: Adjust key inputs such as growth rates, WACC, and capital expenditures to fit your analysis.
- 3. View Results in Real-Time: The DCF model automatically computes intrinsic value and NPV based on your inputs.
- 4. Explore Scenarios: Evaluate various forecasts to examine different valuation possibilities.
- 5. Present with Assurance: Deliver professional valuation insights to bolster your decision-making process.
Why Choose This Calculator for ACCO Brands Corporation (ACCO)?
- Accuracy: Utilizes real ACCO financials to ensure precise data.
- Flexibility: Allows users to easily test and modify inputs as needed.
- Time-Saving: Eliminates the need to construct a DCF model from the ground up.
- Professional-Grade: Crafted with the precision and usability expected by CFOs.
- User-Friendly: Intuitive design makes it accessible for users without extensive financial modeling skills.
Who Should Use ACCO Brands Corporation (ACCO)?
- Investors: Make informed decisions with a reliable valuation tool tailored for ACCO.
- Financial Analysts: Streamline your workflow with a customizable DCF model specifically for ACCO.
- Consultants: Effortlessly modify the template for client presentations or reports related to ACCO.
- Finance Enthusiasts: Enhance your knowledge of valuation methods through real-world insights on ACCO.
- Educators and Students: Utilize it as a practical resource in finance courses focused on ACCO and its market.
What the Template Contains
- Pre-Filled Data: Includes ACCO Brands Corporation’s historical financials and forecasts.
- Discounted Cash Flow Model: Editable DCF valuation model with automatic calculations.
- Weighted Average Cost of Capital (WACC): A dedicated sheet for calculating WACC based on custom inputs.
- Key Financial Ratios: Analyze ACCO’s profitability, efficiency, and leverage.
- Customizable Inputs: Edit revenue growth, margins, and tax rates with ease.
- Clear Dashboard: Charts and tables summarizing key valuation results.
Disclaimer
All information, articles, and product details provided on this website are for general informational and educational purposes only. We do not claim any ownership over, nor do we intend to infringe upon, any trademarks, copyrights, logos, brand names, or other intellectual property mentioned or depicted on this site. Such intellectual property remains the property of its respective owners, and any references here are made solely for identification or informational purposes, without implying any affiliation, endorsement, or partnership.
We make no representations or warranties, express or implied, regarding the accuracy, completeness, or suitability of any content or products presented. Nothing on this website should be construed as legal, tax, investment, financial, medical, or other professional advice. In addition, no part of this site—including articles or product references—constitutes a solicitation, recommendation, endorsement, advertisement, or offer to buy or sell any securities, franchises, or other financial instruments, particularly in jurisdictions where such activity would be unlawful.
All content is of a general nature and may not address the specific circumstances of any individual or entity. It is not a substitute for professional advice or services. Any actions you take based on the information provided here are strictly at your own risk. You accept full responsibility for any decisions or outcomes arising from your use of this website and agree to release us from any liability in connection with your use of, or reliance upon, the content or products found herein.