
|
Ackermans & Van Haaren NV (ACKB.BR) DCF Valoración |
Completamente Editable: Adáptelo A Sus Necesidades En Excel O Sheets
Diseño Profesional: Plantillas Confiables Y Estándares De La Industria
Predeterminadas Para Un Uso Rápido Y Eficiente
Compatible con MAC / PC, completamente desbloqueado
No Se Necesita Experiencia; Fáciles De Seguir
Ackermans & Van Haaren NV (ACKB.BR) Bundle
Evaluar ackermans & ¡La perspectiva financiera de Van Haaren NV con la experiencia! Esta calculadora DCF (ACKBBR) proporciona información financiera previa al llenado, al tiempo que ofrece flexibilidad total para modificar el crecimiento de los ingresos, WACC, los márgenes y otros supuestos críticos para alinearse con sus proyecciones.
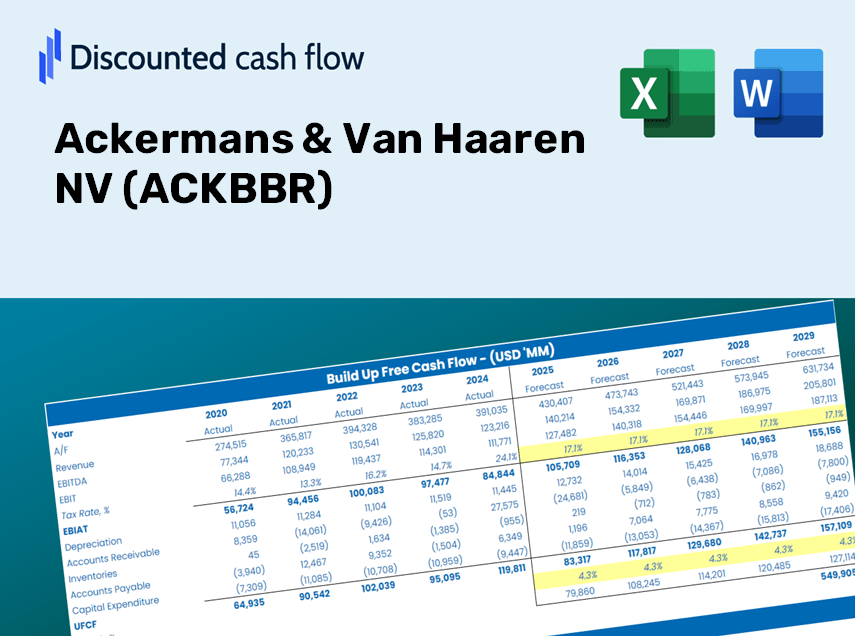
Discounted Cash Flow (DCF) - (USD MM)
| Year | AY1 2020 |
AY2 2021 |
AY3 2022 |
AY4 2023 |
AY5 2024 |
FY1 2025 |
FY2 2026 |
FY3 2027 |
FY4 2028 |
FY5 2029 |
|---|---|---|---|---|---|---|---|---|---|---|
| Revenue | 3,910.3 | 4,312.4 | 4,401.4 | 5,221.6 | 6,043.3 | 6,749.2 | 7,537.5 | 8,417.9 | 9,401.1 | 10,499.2 |
| Revenue Growth, % | 0 | 10.28 | 2.06 | 18.63 | 15.74 | 11.68 | 11.68 | 11.68 | 11.68 | 11.68 |
| EBITDA | 558.2 | 975.9 | 1,062.7 | 1,053.4 | 1,248.1 | 1,375.2 | 1,535.8 | 1,715.2 | 1,915.5 | 2,139.2 |
| EBITDA, % | 14.27 | 22.63 | 24.14 | 20.17 | 20.65 | 20.38 | 20.38 | 20.38 | 20.38 | 20.38 |
| Depreciation | 350.8 | 350.6 | 359.6 | 385.3 | 440.3 | 539.1 | 602.0 | 672.3 | 750.9 | 838.6 |
| Depreciation, % | 8.97 | 8.13 | 8.17 | 7.38 | 7.29 | 7.99 | 7.99 | 7.99 | 7.99 | 7.99 |
| EBIT | 207.4 | 625.4 | 703.1 | 668.1 | 807.7 | 836.1 | 933.8 | 1,042.8 | 1,164.6 | 1,300.7 |
| EBIT, % | 5.3 | 14.5 | 15.98 | 12.8 | 13.37 | 12.39 | 12.39 | 12.39 | 12.39 | 12.39 |
| Total Cash | 1,388.7 | 1,459.7 | 1,705.5 | 1,579.8 | 3,942.3 | 2,748.3 | 3,069.3 | 3,427.8 | 3,828.2 | 4,275.3 |
| Total Cash, percent | .0 | .0 | .0 | .0 | .0 | .0 | .0 | .0 | .0 | .0 |
| Account Receivables | 3,042.5 | 3,294.9 | 2,850.4 | 3,776.6 | 3,379.1 | 4,686.9 | 5,234.3 | 5,845.6 | 6,528.4 | 7,291.0 |
| Account Receivables, % | 77.81 | 76.41 | 64.76 | 72.33 | 55.91 | 69.44 | 69.44 | 69.44 | 69.44 | 69.44 |
| Inventories | 782.5 | 854.7 | 922.0 | 1,196.0 | 387.6 | 1,216.2 | 1,358.2 | 1,516.9 | 1,694.0 | 1,891.9 |
| Inventories, % | 20.01 | 19.82 | 20.95 | 22.91 | 6.41 | 18.02 | 18.02 | 18.02 | 18.02 | 18.02 |
| Accounts Payable | 1,092.8 | 1,145.1 | 1,136.2 | 1,266.8 | 1,523.3 | 1,751.9 | 1,956.5 | 2,185.0 | 2,440.2 | 2,725.3 |
| Accounts Payable, % | 27.95 | 26.55 | 25.82 | 24.26 | 25.21 | 25.96 | 25.96 | 25.96 | 25.96 | 25.96 |
| Capital Expenditure | -236.6 | -319.0 | -514.5 | -434.0 | -310.2 | -520.8 | -581.6 | -649.6 | -725.4 | -810.2 |
| Capital Expenditure, % | -6.05 | -7.4 | -11.69 | -8.31 | -5.13 | -7.72 | -7.72 | -7.72 | -7.72 | -7.72 |
| Tax Rate, % | 38.21 | 38.21 | 38.21 | 38.21 | 38.21 | 38.21 | 38.21 | 38.21 | 38.21 | 38.21 |
| EBITAT | 328.4 | 756.1 | 771.7 | 437.5 | 499.1 | 714.5 | 798.0 | 891.2 | 995.3 | 1,111.5 |
| Depreciation | ||||||||||
| Changes in Account Receivables | ||||||||||
| Changes in Inventories | ||||||||||
| Changes in Accounts Payable | ||||||||||
| Capital Expenditure | ||||||||||
| UFCF | -2,289.5 | 515.3 | 985.0 | -680.9 | 2,091.8 | -1,175.0 | 333.5 | 372.4 | 415.9 | 464.5 |
| WACC, % | 5.02 | 5.02 | 5.02 | 4.27 | 4.19 | 4.7 | 4.7 | 4.7 | 4.7 | 4.7 |
| PV UFCF | ||||||||||
| SUM PV UFCF | 221.7 | |||||||||
| Long Term Growth Rate, % | 2.00 | |||||||||
| Free cash flow (T + 1) | 474 | |||||||||
| Terminal Value | 17,533 | |||||||||
| Present Terminal Value | 13,934 | |||||||||
| Enterprise Value | 14,155 | |||||||||
| Net Debt | 6,661 | |||||||||
| Equity Value | 7,494 | |||||||||
| Diluted Shares Outstanding, MM | 33 | |||||||||
| Equity Value Per Share | 229.03 |
Benefits You Will Receive
- Flexible Forecast Inputs: Modify key assumptions (growth %, margins, WACC) to explore various scenarios effortlessly.
- Comprehensive Financial Data: Pre-filled financial information for Ackermans & Van Haaren NV (ACKBBR) to kickstart your evaluation.
- Automated DCF Calculations: The template provides calculations for Net Present Value (NPV) and intrinsic value automatically.
- Professional and Customizable Design: A refined Excel model tailored to meet your valuation requirements.
- Designed for Analysts and Investors: Perfect for analyzing forecasts, validating strategies, and enhancing efficiency.
Notable Features
- Authentic Financial Data: Gain access to reliable pre-loaded historical figures and future forecasts for Ackermans & Van Haaren NV (ACKBBR).
- Adjustable Forecast Parameters: Modify highlighted cells such as WACC, growth rates, and profit margins to suit your analysis.
- Real-Time Calculations: Immediate updates to DCF, Net Present Value (NPV), and cash flow assessments.
- Interactive Dashboard: User-friendly charts and summaries for clear visualization of your valuation findings.
- Designed for All Skill Levels: An intuitive layout tailored for investors, CFOs, and consultants, whether experienced or novice.
How It Functions
- Step 1: Download the Excel spreadsheet.
- Step 2: Examine the pre-filled data for Ackermans & Van Haaren NV (ACKBBR) – both historical and projected.
- Step 3: Modify the key assumptions (highlighted in yellow) according to your analysis.
- Step 4: Observe the automatic recalculations reflecting Ackermans & Van Haaren NV's (ACKBBR) intrinsic value.
- Step 5: Utilize the results for making investment decisions or for reporting purposes.
Why Opt for This Calculator?
- Designed for Experts: A sophisticated tool utilized by analysts, CFOs, and financial consultants.
- Accurate Data: Preloaded historical and projected financials for Ackermans & Van Haaren NV (ACKBBR) ensure precision.
- Scenario Analysis: Effortlessly test various forecasts and assumptions.
- Comprehensive Outputs: Instantly calculates intrinsic value, NPV, and other essential metrics.
- User-Friendly: Step-by-step guidance simplifies the entire process.
Who Can Benefit from Ackermans & Van Haaren NV (ACKBBR)?
- Investors: Enhance your investment decisions with our sophisticated valuation tools.
- Financial Analysts: Streamline your analysis using our customizable DCF model.
- Consultants: Effortlessly tailor our templates for impactful client presentations and reports.
- Finance Enthusiasts: Expand your knowledge of valuation methods through practical, real-world applications.
- Educators and Students: Utilize this resource as a hands-on learning aid in finance courses.
Contents of the Template
- Preloaded ACKBBR Data: Historical and projected financial information, including revenue, EBIT, and capital expenditures.
- DCF and WACC Models: High-quality sheets designed for calculating intrinsic value and Weighted Average Cost of Capital.
- Editable Inputs: Yellow-highlighted cells for customizing revenue growth, tax rates, and discount rates.
- Financial Statements: Detailed annual and quarterly financials for in-depth analysis.
- Key Ratios: Profitability, leverage, and efficiency ratios to assess performance.
- Dashboard and Charts: Visual representations of valuation results and underlying assumptions.
Disclaimer
All information, articles, and product details provided on this website are for general informational and educational purposes only. We do not claim any ownership over, nor do we intend to infringe upon, any trademarks, copyrights, logos, brand names, or other intellectual property mentioned or depicted on this site. Such intellectual property remains the property of its respective owners, and any references here are made solely for identification or informational purposes, without implying any affiliation, endorsement, or partnership.
We make no representations or warranties, express or implied, regarding the accuracy, completeness, or suitability of any content or products presented. Nothing on this website should be construed as legal, tax, investment, financial, medical, or other professional advice. In addition, no part of this site—including articles or product references—constitutes a solicitation, recommendation, endorsement, advertisement, or offer to buy or sell any securities, franchises, or other financial instruments, particularly in jurisdictions where such activity would be unlawful.
All content is of a general nature and may not address the specific circumstances of any individual or entity. It is not a substitute for professional advice or services. Any actions you take based on the information provided here are strictly at your own risk. You accept full responsibility for any decisions or outcomes arising from your use of this website and agree to release us from any liability in connection with your use of, or reliance upon, the content or products found herein.