
|
Valoración DCF de ADMA Biologics, Inc. (ADMA) |
Completamente Editable: Adáptelo A Sus Necesidades En Excel O Sheets
Diseño Profesional: Plantillas Confiables Y Estándares De La Industria
Predeterminadas Para Un Uso Rápido Y Eficiente
Compatible con MAC / PC, completamente desbloqueado
No Se Necesita Experiencia; Fáciles De Seguir
ADMA Biologics, Inc. (ADMA) Bundle
¿Busca evaluar el valor intrínseco de ADMA Biologics, Inc.? Nuestra calculadora DCF (ADMA) integra datos del mundo real con características integrales de personalización, lo que le permite refinar sus pronósticos y tomar decisiones de inversión más informadas.
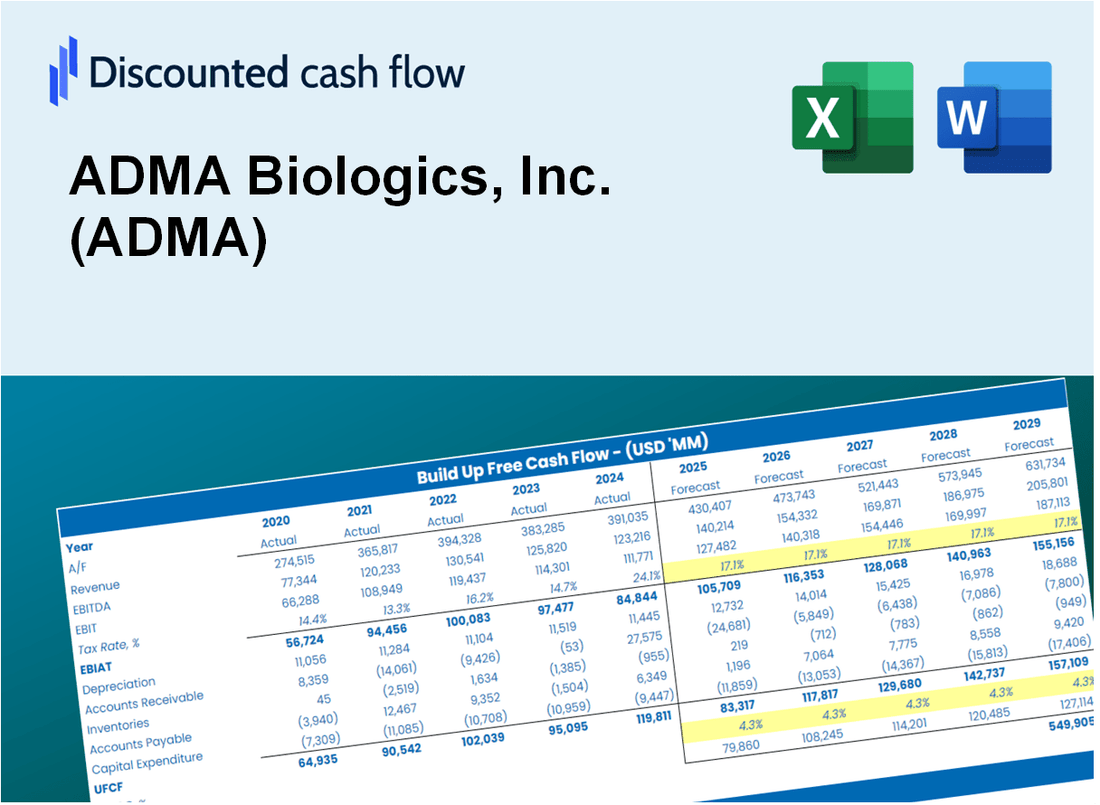
Discounted Cash Flow (DCF) - (USD MM)
| Year | AY1 2020 |
AY2 2021 |
AY3 2022 |
AY4 2023 |
AY5 2024 |
FY1 2025 |
FY2 2026 |
FY3 2027 |
FY4 2028 |
FY5 2029 |
|---|---|---|---|---|---|---|---|---|---|---|
| Revenue | 42.2 | 80.9 | 154.1 | 258.2 | 426.5 | 762.1 | 1,361.9 | 2,433.7 | 4,349.2 | 7,772.1 |
| Revenue Growth, % | 0 | 91.72 | 90.36 | 67.59 | 65.15 | 78.7 | 78.7 | 78.7 | 78.7 | 78.7 |
| EBITDA | -59.8 | -53.1 | -39.5 | 5.1 | 147.7 | -235.7 | -421.2 | -752.6 | -1,345.0 | -2,403.5 |
| EBITDA, % | -141.69 | -65.6 | -25.64 | 1.98 | 34.63 | -30.92 | -30.92 | -30.92 | -30.92 | -30.92 |
| Depreciation | 3.9 | 5.5 | 7.1 | 8.3 | 8.0 | 39.4 | 70.4 | 125.9 | 224.9 | 401.9 |
| Depreciation, % | 9.34 | 6.79 | 4.62 | 3.23 | 1.89 | 5.17 | 5.17 | 5.17 | 5.17 | 5.17 |
| EBIT | -63.8 | -58.6 | -46.6 | -3.2 | 139.6 | -260.9 | -466.2 | -833.0 | -1,488.7 | -2,660.3 |
| EBIT, % | -151.03 | -72.39 | -30.26 | -1.24 | 32.75 | -34.23 | -34.23 | -34.23 | -34.23 | -34.23 |
| Total Cash | 55.9 | 51.1 | 86.5 | 51.4 | 103.1 | 401.4 | 717.3 | 1,281.8 | 2,290.7 | 4,093.5 |
| Total Cash, percent | .0 | .0 | .0 | .0 | .0 | .0 | .0 | .0 | .0 | .0 |
| Account Receivables | 13.2 | 28.6 | 15.5 | 27.4 | 50.0 | 151.0 | 269.8 | 482.2 | 861.7 | 1,539.9 |
| Account Receivables, % | 31.35 | 35.3 | 10.06 | 10.62 | 11.72 | 19.81 | 19.81 | 19.81 | 19.81 | 19.81 |
| Inventories | 81.5 | 124.7 | 163.3 | 172.9 | 170.2 | 620.2 | 1,108.2 | 1,980.5 | 3,539.2 | 6,324.6 |
| Inventories, % | 193.12 | 154.09 | 105.97 | 66.96 | 39.92 | 81.38 | 81.38 | 81.38 | 81.38 | 81.38 |
| Accounts Payable | 11.1 | 12.4 | 13.2 | 15.7 | 20.2 | 92.9 | 166.1 | 296.8 | 530.4 | 947.8 |
| Accounts Payable, % | 26.23 | 15.36 | 8.59 | 6.06 | 4.74 | 12.2 | 12.2 | 12.2 | 12.2 | 12.2 |
| Capital Expenditure | -12.7 | -13.5 | -13.9 | -5.0 | -8.6 | -91.2 | -162.9 | -291.1 | -520.2 | -929.6 |
| Capital Expenditure, % | -30.14 | -16.69 | -9.03 | -1.93 | -2.01 | -11.96 | -11.96 | -11.96 | -11.96 | -11.96 |
| Tax Rate, % | -57.24 | -57.24 | -57.24 | -57.24 | -57.24 | -57.24 | -57.24 | -57.24 | -57.24 | -57.24 |
| EBITAT | -63.8 | -58.6 | -46.6 | -3.2 | 219.6 | -260.9 | -466.2 | -833.0 | -1,488.7 | -2,660.3 |
| Depreciation | ||||||||||
| Changes in Account Receivables | ||||||||||
| Changes in Inventories | ||||||||||
| Changes in Accounts Payable | ||||||||||
| Capital Expenditure | ||||||||||
| UFCF | -156.2 | -123.8 | -78.1 | -19.0 | 203.7 | -790.8 | -1,092.4 | -1,952.2 | -3,488.6 | -6,234.2 |
| WACC, % | 6.09 | 6.09 | 6.09 | 6.09 | 6.09 | 6.09 | 6.09 | 6.09 | 6.09 | 6.09 |
| PV UFCF | ||||||||||
| SUM PV UFCF | -10,743.4 | |||||||||
| Long Term Growth Rate, % | 2.00 | |||||||||
| Free cash flow (T + 1) | -6,359 | |||||||||
| Terminal Value | -155,459 | |||||||||
| Present Terminal Value | -115,674 | |||||||||
| Enterprise Value | -126,418 | |||||||||
| Net Debt | -21 | |||||||||
| Equity Value | -126,397 | |||||||||
| Diluted Shares Outstanding, MM | 243 | |||||||||
| Equity Value Per Share | -519.42 |
What You Will Get
- Editable Excel Template: A fully customizable Excel-based DCF Calculator featuring pre-filled real ADMA financials.
- Real-World Data: Historical data and forward-looking estimates (highlighted in the yellow cells).
- Forecast Flexibility: Adjust forecast assumptions such as revenue growth, EBITDA %, and WACC.
- Automatic Calculations: Instantly observe the effect of your inputs on ADMA’s valuation.
- Professional Tool: Designed for investors, CFOs, consultants, and financial analysts.
- User-Friendly Design: Organized for clarity and usability, complete with step-by-step instructions.
Key Features
- Customizable Financial Inputs: Adjust essential parameters such as revenue projections, gross margin %, and operational costs.
- Instant DCF Analysis: Quickly computes intrinsic value, net present value (NPV), and other key metrics.
- High-Precision Valuation: Leverages ADMA Biologics’ actual financial data for accurate valuation results.
- Effortless Scenario Testing: Explore various assumptions and analyze results with ease.
- Efficiency Booster: Streamline the valuation process without the hassle of developing intricate models from the ground up.
How It Works
- Download the Template: Gain immediate access to the Excel-based ADMA DCF Calculator.
- Input Your Assumptions: Modify the yellow-highlighted cells for growth rates, WACC, margins, and additional parameters.
- Instant Calculations: The model automatically recalculates ADMA’s intrinsic value.
- Test Scenarios: Experiment with various assumptions to assess potential changes in valuation.
- Analyze and Decide: Utilize the results to inform your investment or financial analysis.
Why Choose This Calculator for ADMA Biologics, Inc. (ADMA)?
- Accurate Data: Real ADMA financials provide trustworthy valuation outcomes.
- Customizable: Modify essential parameters such as growth rates, WACC, and tax rates to align with your forecasts.
- Time-Saving: Pre-configured calculations mean you won’t have to start from the ground up.
- Professional-Grade Tool: Tailored for investors, analysts, and consultants in the biotech sector.
- User-Friendly: Easy-to-navigate layout and clear instructions ensure accessibility for all users.
Who Should Use This Product?
- Investors: Accurately assess ADMA Biologics, Inc.'s (ADMA) fair value prior to making investment choices.
- CFOs: Utilize a professional-grade DCF model for financial reporting and analysis specific to ADMA.
- Consultants: Efficiently customize the template for valuation reports tailored to ADMA's clients.
- Entrepreneurs: Acquire insights into financial modeling practices employed by leading biotech companies.
- Educators: Implement it as a teaching resource to illustrate valuation methodologies relevant to the biotech sector.
What the Template Contains
- Historical Data: Contains ADMA Biologics, Inc.'s (ADMA) previous financials and foundational forecasts.
- DCF and Levered DCF Models: Comprehensive templates for calculating the intrinsic value of ADMA Biologics, Inc. (ADMA).
- WACC Sheet: Pre-configured calculations for the Weighted Average Cost of Capital.
- Editable Inputs: Adjust critical drivers such as growth rates, EBITDA %, and CAPEX assumptions.
- Quarterly and Annual Statements: A thorough breakdown of ADMA Biologics, Inc.'s (ADMA) financials.
- Interactive Dashboard: Dynamically visualize valuation results and forecasts.
Disclaimer
All information, articles, and product details provided on this website are for general informational and educational purposes only. We do not claim any ownership over, nor do we intend to infringe upon, any trademarks, copyrights, logos, brand names, or other intellectual property mentioned or depicted on this site. Such intellectual property remains the property of its respective owners, and any references here are made solely for identification or informational purposes, without implying any affiliation, endorsement, or partnership.
We make no representations or warranties, express or implied, regarding the accuracy, completeness, or suitability of any content or products presented. Nothing on this website should be construed as legal, tax, investment, financial, medical, or other professional advice. In addition, no part of this site—including articles or product references—constitutes a solicitation, recommendation, endorsement, advertisement, or offer to buy or sell any securities, franchises, or other financial instruments, particularly in jurisdictions where such activity would be unlawful.
All content is of a general nature and may not address the specific circumstances of any individual or entity. It is not a substitute for professional advice or services. Any actions you take based on the information provided here are strictly at your own risk. You accept full responsibility for any decisions or outcomes arising from your use of this website and agree to release us from any liability in connection with your use of, or reliance upon, the content or products found herein.