
|
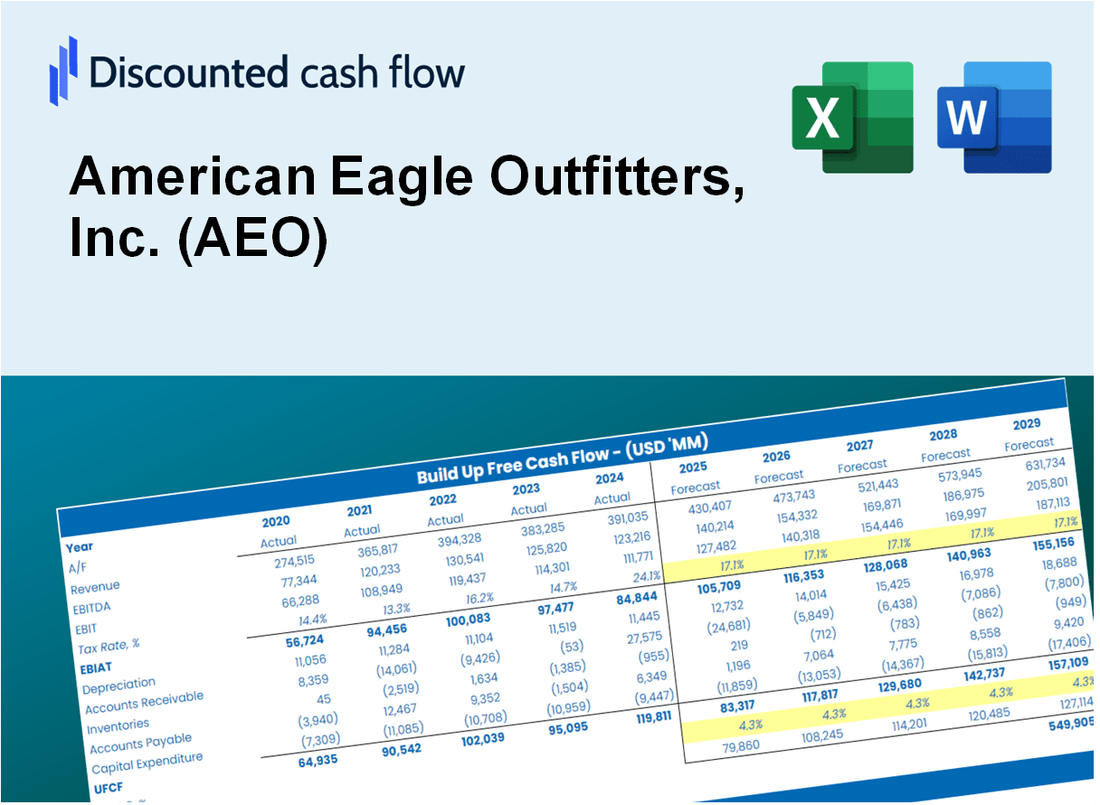
Valoración DCF de American Eagle Outfitters, Inc. (AEO) |
Completamente Editable: Adáptelo A Sus Necesidades En Excel O Sheets
Diseño Profesional: Plantillas Confiables Y Estándares De La Industria
Predeterminadas Para Un Uso Rápido Y Eficiente
Compatible con MAC / PC, completamente desbloqueado
No Se Necesita Experiencia; Fáciles De Seguir
American Eagle Outfitters, Inc. (AEO) Bundle
¡Domine su análisis de valoración American Eagle Outfitters, Inc. (AEO) utilizando nuestra sofisticada calculadora DCF! Completamente equipado con datos AEO reales, esta plantilla de Excel le permite ajustar los pronósticos y supuestos para determinar con precisión el valor intrínseco de American Eagle Outfitters, Inc. (AEO).
What You Will Get
- Pre-Filled Financial Model: American Eagle Outfitters, Inc.’s (AEO) actual data allows for accurate DCF valuation.
- Full Forecast Control: Modify revenue growth, profit margins, WACC, and other essential drivers.
- Instant Calculations: Real-time updates ensure you see results immediately as adjustments are made.
- Investor-Ready Template: A polished Excel file crafted for high-quality valuation presentations.
- Customizable and Reusable: Designed for adaptability, enabling repeated use for comprehensive forecasts.
Key Features
- Pre-Loaded Data: American Eagle Outfitters' historical financial statements and pre-filled forecasts.
- Fully Adjustable Inputs: Modify WACC, tax rates, revenue growth, and EBITDA margins.
- Instant Results: Observe AEO’s intrinsic value recalculating in real time.
- Clear Visual Outputs: Dashboard charts illustrate valuation results and key metrics.
- Built for Accuracy: A professional tool designed for analysts, investors, and finance experts.
How It Works
- 1. Access the Template: Download and open the Excel file featuring American Eagle Outfitters, Inc. (AEO) preloaded data.
- 2. Modify Assumptions: Update essential inputs such as growth rates, WACC, and capital expenditures.
- 3. View Results Instantly: The DCF model automatically calculates intrinsic value and NPV in real-time.
- 4. Explore Scenarios: Analyze different valuation outcomes by comparing various forecasts.
- 5. Present with Assurance: Deliver professional valuation insights to enhance your decision-making process.
Why Choose This Calculator for American Eagle Outfitters, Inc. (AEO)?
- Designed for Retail Experts: A sophisticated tool tailored for analysts, CFOs, and retail consultants.
- Comprehensive Data: American Eagle's historical and projected financials are preloaded for enhanced precision.
- Flexible Scenario Analysis: Easily simulate various forecasts and assumptions to inform decision-making.
- Insightful Outputs: Automatically calculates intrinsic value, NPV, and essential financial metrics.
- User-Friendly Interface: Step-by-step guidance ensures a smooth navigation through the calculations.
Who Should Use This Product?
- Investors: Accurately assess American Eagle Outfitters' (AEO) fair value prior to making investment decisions.
- CFOs: Utilize a professional-grade DCF model for comprehensive financial reporting and analysis of American Eagle Outfitters (AEO).
- Consultants: Efficiently customize the template for valuation reports tailored to clients of American Eagle Outfitters (AEO).
- Entrepreneurs: Acquire insights into financial modeling practices employed by leading apparel retailers like American Eagle Outfitters (AEO).
- Educators: Implement it as a teaching resource to illustrate valuation methodologies relevant to the retail sector.
What the Template Contains
- Historical Data: Includes American Eagle Outfitters, Inc.'s (AEO) past financials and baseline forecasts.
- DCF and Levered DCF Models: Detailed templates to calculate American Eagle Outfitters, Inc.'s (AEO) intrinsic value.
- WACC Sheet: Pre-built calculations for Weighted Average Cost of Capital.
- Editable Inputs: Modify key drivers like growth rates, EBITDA %, and CAPEX assumptions.
- Quarterly and Annual Statements: A complete breakdown of American Eagle Outfitters, Inc.'s (AEO) financials.
- Interactive Dashboard: Visualize valuation results and projections dynamically.
Disclaimer
All information, articles, and product details provided on this website are for general informational and educational purposes only. We do not claim any ownership over, nor do we intend to infringe upon, any trademarks, copyrights, logos, brand names, or other intellectual property mentioned or depicted on this site. Such intellectual property remains the property of its respective owners, and any references here are made solely for identification or informational purposes, without implying any affiliation, endorsement, or partnership.
We make no representations or warranties, express or implied, regarding the accuracy, completeness, or suitability of any content or products presented. Nothing on this website should be construed as legal, tax, investment, financial, medical, or other professional advice. In addition, no part of this site—including articles or product references—constitutes a solicitation, recommendation, endorsement, advertisement, or offer to buy or sell any securities, franchises, or other financial instruments, particularly in jurisdictions where such activity would be unlawful.
All content is of a general nature and may not address the specific circumstances of any individual or entity. It is not a substitute for professional advice or services. Any actions you take based on the information provided here are strictly at your own risk. You accept full responsibility for any decisions or outcomes arising from your use of this website and agree to release us from any liability in connection with your use of, or reliance upon, the content or products found herein.