
|
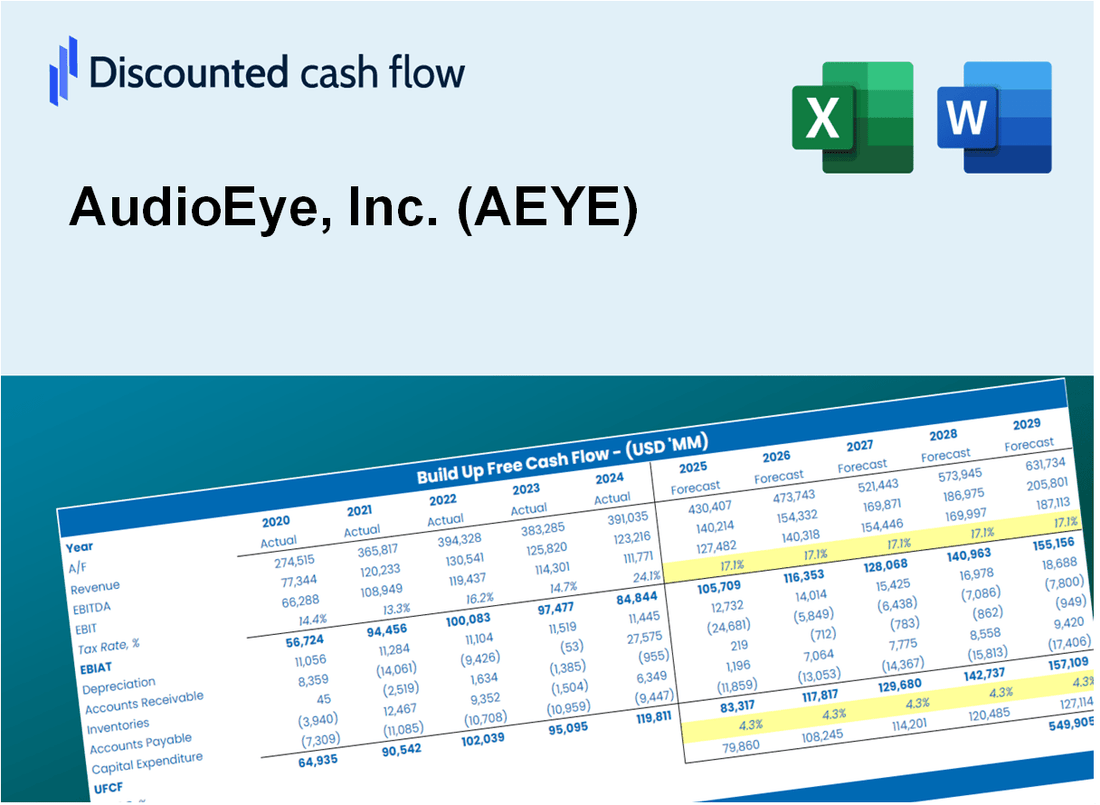
Valoración DCF de AudioEye, Inc. (AEYE) |
Completamente Editable: Adáptelo A Sus Necesidades En Excel O Sheets
Diseño Profesional: Plantillas Confiables Y Estándares De La Industria
Predeterminadas Para Un Uso Rápido Y Eficiente
Compatible con MAC / PC, completamente desbloqueado
No Se Necesita Experiencia; Fáciles De Seguir
AudioEye, Inc. (AEYE) Bundle
¡Agilice su análisis y mejore la precisión con nuestra calculadora DCF AudioEye, Inc. (AEYE)! Utilizando datos en tiempo real y supuestos personalizables, esta herramienta le permite pronosticar, evaluar y evaluar AudioEye, Inc. como un inversor experimentado.
Discounted Cash Flow (DCF) - (USD MM)
| Year | AY1 2020 |
AY2 2021 |
AY3 2022 |
AY4 2023 |
AY5 2024 |
FY1 2025 |
FY2 2026 |
FY3 2027 |
FY4 2028 |
FY5 2029 |
|---|---|---|---|---|---|---|---|---|---|---|
| Revenue | 20.5 | 24.5 | 29.9 | 31.3 | 35.2 | 40.4 | 46.3 | 53.1 | 61.0 | 69.9 |
| Revenue Growth, % | 0 | 19.67 | 22.08 | 4.69 | 12.41 | 14.71 | 14.71 | 14.71 | 14.71 | 14.71 |
| EBITDA | -5.8 | -12.6 | -7.8 | -3.3 | -.6 | -9.6 | -11.0 | -12.6 | -14.4 | -16.6 |
| EBITDA, % | -28.52 | -51.46 | -25.95 | -10.66 | -1.8 | -23.68 | -23.68 | -23.68 | -23.68 | -23.68 |
| Depreciation | 1.2 | 1.6 | 2.7 | 2.6 | 2.8 | 3.0 | 3.5 | 4.0 | 4.6 | 5.2 |
| Depreciation, % | 5.73 | 6.48 | 8.92 | 8.39 | 7.83 | 7.47 | 7.47 | 7.47 | 7.47 | 7.47 |
| EBIT | -7.0 | -14.2 | -10.4 | -6.0 | -3.4 | -12.6 | -14.4 | -16.5 | -19.0 | -21.8 |
| EBIT, % | -34.25 | -57.94 | -34.86 | -19.05 | -9.63 | -31.15 | -31.15 | -31.15 | -31.15 | -31.15 |
| Total Cash | 9.1 | 19.0 | 6.9 | 9.2 | 5.7 | 15.4 | 17.6 | 20.2 | 23.2 | 26.6 |
| Total Cash, percent | .0 | .0 | .0 | .0 | .0 | .0 | .0 | .0 | .0 | .0 |
| Account Receivables | 5.1 | 5.3 | 5.4 | 4.8 | 5.9 | 7.8 | 9.0 | 10.3 | 11.8 | 13.6 |
| Account Receivables, % | 24.89 | 21.67 | 18.11 | 15.42 | 16.85 | 19.39 | 19.39 | 19.39 | 19.39 | 19.39 |
| Inventories | .2 | .0 | .0 | .0 | .0 | .1 | .1 | .1 | .1 | .1 |
| Inventories, % | 0.74237 | 0 | 0 | 0 | 0 | 0.14847 | 0.14847 | 0.14847 | 0.14847 | 0.14847 |
| Accounts Payable | 2.2 | 3.5 | 2.5 | .0 | .0 | 2.7 | 3.1 | 3.5 | 4.1 | 4.7 |
| Accounts Payable, % | 10.7 | 14.46 | 8.2 | 0 | 0 | 6.67 | 6.67 | 6.67 | 6.67 | 6.67 |
| Capital Expenditure | -1.3 | -1.6 | -1.2 | -2.2 | -1.9 | -2.4 | -2.7 | -3.1 | -3.6 | -4.1 |
| Capital Expenditure, % | -6.34 | -6.41 | -4.18 | -6.88 | -5.51 | -5.87 | -5.87 | -5.87 | -5.87 | -5.87 |
| Tax Rate, % | 0 | 0 | 0 | 0 | 0 | 0 | 0 | 0 | 0 | 0 |
| EBITAT | -7.0 | -14.2 | -10.4 | -6.0 | -3.4 | -12.6 | -14.4 | -16.5 | -19.0 | -21.8 |
| Depreciation | ||||||||||
| Changes in Account Receivables | ||||||||||
| Changes in Inventories | ||||||||||
| Changes in Accounts Payable | ||||||||||
| Capital Expenditure | ||||||||||
| UFCF | -10.2 | -12.9 | -10.2 | -7.4 | -3.7 | -11.2 | -14.4 | -16.6 | -19.0 | -21.8 |
| WACC, % | 7.33 | 7.33 | 7.33 | 7.33 | 7.33 | 7.33 | 7.33 | 7.33 | 7.33 | 7.33 |
| PV UFCF | ||||||||||
| SUM PV UFCF | -66.0 | |||||||||
| Long Term Growth Rate, % | 2.00 | |||||||||
| Free cash flow (T + 1) | -22 | |||||||||
| Terminal Value | -417 | |||||||||
| Present Terminal Value | -293 | |||||||||
| Enterprise Value | -359 | |||||||||
| Net Debt | 2 | |||||||||
| Equity Value | -360 | |||||||||
| Diluted Shares Outstanding, MM | 12 | |||||||||
| Equity Value Per Share | -30.31 |
What You Will Get
- Comprehensive AEYE Financials: Access to historical and projected data for precise valuation.
- Customizable Parameters: Adjust WACC, tax rates, revenue growth, and capital expenditures as needed.
- Real-Time Calculations: Intrinsic value and NPV are computed automatically.
- Scenario Analysis: Evaluate various scenarios to assess AudioEye’s future potential.
- User-Friendly Interface: Designed for professionals while remaining approachable for newcomers.
Key Features
- Comprehensive AEYE Data: Pre-loaded with AudioEye's historical performance metrics and future projections.
- Flexible Input Options: Modify revenue growth rates, profit margins, discount rates, tax implications, and capital investments.
- Interactive Valuation Framework: Automatically recalculates Net Present Value (NPV) and intrinsic value based on your adjustments.
- Scenario Analysis: Develop various forecasting scenarios to evaluate different valuation possibilities.
- Intuitive User Interface: Clean, organized, and suitable for both seasoned professionals and newcomers.
How It Works
- Step 1: Download the Excel file.
- Step 2: Review pre-entered AudioEye data (historical and projected).
- Step 3: Adjust key assumptions (yellow cells) based on your analysis.
- Step 4: View automatic recalculations for AudioEye’s intrinsic value.
- Step 5: Use the outputs for investment decisions or reporting.
Why Choose This Calculator for AudioEye, Inc. (AEYE)?
- Accurate Data: Reliable financial metrics for AudioEye ensure trustworthy valuation outcomes.
- Customizable: Tailor essential factors like growth projections, discount rates, and tax assumptions to fit your analysis.
- Time-Saving: Integrated calculations streamline your workflow, so you don’t have to build from the ground up.
- Professional-Grade Tool: Crafted for investors, financial analysts, and industry consultants.
- User-Friendly: Easy-to-navigate interface and clear instructions cater to users of all experience levels.
Who Should Use AudioEye, Inc. (AEYE)?
- Accessibility Advocates: Evaluate and promote web accessibility solutions to enhance user experience.
- Corporate Compliance Teams: Assess accessibility standards to ensure regulatory adherence.
- Consultants and Advisors: Offer expert guidance on implementing effective accessibility strategies for clients.
- Students and Educators: Learn and teach about digital accessibility using real-world case studies.
- Tech Enthusiasts: Explore the impact of accessibility technology on the digital landscape.
What the Template Contains
- Historical Data: Includes AudioEye, Inc.'s past financials and baseline forecasts.
- DCF and Levered DCF Models: Detailed templates to calculate AudioEye, Inc.'s intrinsic value.
- WACC Sheet: Pre-built calculations for Weighted Average Cost of Capital.
- Editable Inputs: Modify key drivers like growth rates, EBITDA %, and CAPEX assumptions.
- Quarterly and Annual Statements: A complete breakdown of AudioEye, Inc.'s financials.
- Interactive Dashboard: Visualize valuation results and projections dynamically.
Disclaimer
All information, articles, and product details provided on this website are for general informational and educational purposes only. We do not claim any ownership over, nor do we intend to infringe upon, any trademarks, copyrights, logos, brand names, or other intellectual property mentioned or depicted on this site. Such intellectual property remains the property of its respective owners, and any references here are made solely for identification or informational purposes, without implying any affiliation, endorsement, or partnership.
We make no representations or warranties, express or implied, regarding the accuracy, completeness, or suitability of any content or products presented. Nothing on this website should be construed as legal, tax, investment, financial, medical, or other professional advice. In addition, no part of this site—including articles or product references—constitutes a solicitation, recommendation, endorsement, advertisement, or offer to buy or sell any securities, franchises, or other financial instruments, particularly in jurisdictions where such activity would be unlawful.
All content is of a general nature and may not address the specific circumstances of any individual or entity. It is not a substitute for professional advice or services. Any actions you take based on the information provided here are strictly at your own risk. You accept full responsibility for any decisions or outcomes arising from your use of this website and agree to release us from any liability in connection with your use of, or reliance upon, the content or products found herein.