
|
Assured Guaranty Ltd. (AGO): Análisis PESTLE [Actualizado en Ene-2025] |
Completamente Editable: Adáptelo A Sus Necesidades En Excel O Sheets
Diseño Profesional: Plantillas Confiables Y Estándares De La Industria
Predeterminadas Para Un Uso Rápido Y Eficiente
Compatible con MAC / PC, completamente desbloqueado
No Se Necesita Experiencia; Fáciles De Seguir
Assured Guaranty Ltd. (AGO) Bundle
En el mundo dinámico del seguro de garantía financiera, Assured Garanty Ltd. (AGO) se encuentra en la encrucijada de complejos desafíos globales y soluciones innovadoras. Este análisis integral de la mano presenta el intrincado panorama que da forma a la toma de decisiones estratégicas de hace, explorando cómo las regulaciones políticas, las fluctuaciones económicas, los cambios sociales, los avances tecnológicos, los marcos legales y las consideraciones ambientales convergen para definir el camino de la compañía. Sumerja profundamente en el ecosistema multifacético que impulsa a uno de los jugadores más resistentes en el seguro de bonos municipales, donde cada factor externo se convierte en una oportunidad potencial para el crecimiento y la transformación.
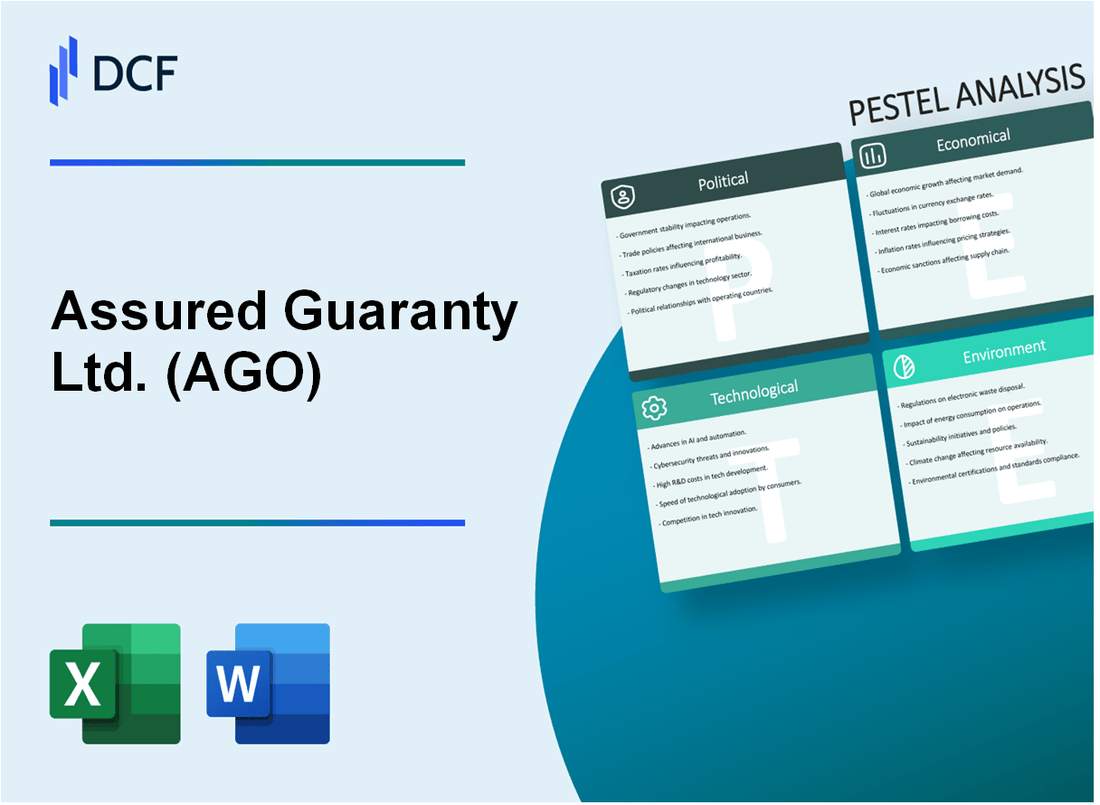
Garantía Garanty Ltd. (AGO) - Análisis de mortero: factores políticos
Cambios regulatorios en el mercado de seguros de bonos municipales
La Ley de Reforma y Protección del Consumidor de Dodd-Frank Wall Street continúa impactando en las operaciones municipales de seguros de bonos de AGO. A partir de 2024, el mercado de seguros de bonos municipales está regulado por la Comisión de Bolsa y Valores (SEC) con $ 3.9 billones en el mercado total de bonos municipales en circulación.
| Cuerpo regulador | Áreas de supervisión clave | Impacto en Ago |
|---|---|---|
| SEGUNDO | Requisitos de divulgación financiera | Costos de cumplimiento estimados en $ 12.5 millones anuales |
| Finra | Comercio y conducta del mercado | Gastos adicionales de monitoreo regulatorio |
Políticas de gasto en infraestructura del gobierno de EE. UU.
La Ley de Inversión y Empleos de Infraestructura asignada $ 1.2 billones Para el desarrollo de infraestructura, impactando directamente los mercados de bonos municipales.
- El proyecto de ley de infraestructura ofrece oportunidades de expansión del mercado potencial
- Se espera que la emisión de bonos municipales aumente en un 17% en 2024
- Posibles flujos de ingresos adicionales para los servicios de garantía de AGO
Cambios de regulación del sector financiero
Las regulaciones bancarias internacionales de Basilea III continúan influyendo en el panorama de seguros de garantía financiera, con impactos de requisitos de capital de aproximadamente $ 450 millones Para las operaciones globales de AGO.
| Marco regulatorio | Requisitos de capital | Costo de cumplimiento |
|---|---|---|
| Basilea III | Relación de capital mínimo del 8% | $ 78.6 millones de gastos de cumplimiento anual |
Políticas de comercio internacional
Mercado de seguros de garantía financiera global afectado por las regulaciones de comercio internacional, con hace operaciones en 32 países.
- Transacciones de garantía financiera transfronteriza valoradas en $ 1.7 mil millones en 2024
- El mercado de seguros de riesgos políticos que crece al 6.2% anualmente
- Tensiones geopolíticas que afectan las estrategias internacionales de garantía financiera
Assured Garanty Ltd. (AGO) - Análisis de mortero: factores económicos
Tasas de interés fluctuantes
A partir del cuarto trimestre de 2023, la tasa de interés de referencia de la Reserva Federal era de 5.33%. El precio de seguro de garantía financiera de AGO se correlaciona directamente con estas tarifas.
| Año | Impacto en la tasa de interés | Ajuste premium de hace |
|---|---|---|
| 2022 | 4.25% - 4.50% | +3.2% de aumento de prima |
| 2023 | 5.25% - 5.50% | +4.7% Aumento de prima |
Recuperación económica e inversión en infraestructura
Las tendencias de inversión de infraestructura muestran un potencial significativo para el crecimiento de AGO.
| Sector de infraestructura | 2023 inversión ($ b) | Crecimiento proyectado |
|---|---|---|
| Bonos municipales | $ 173.4b | 5.2% interanual |
| Infraestructura pública | $ 412.6b | 6.8% interanual |
Incertidumbre económica global
Métricas de estabilidad del mercado de bonos municipales para 2023:
- Emisión total de bonos municipales: $ 426.3b
- Tasa de incumplimiento: 0.08%
- Calificación crediticia rebaja: 2.3%
Condiciones del mercado de crédito
Los parámetros de evaluación de riesgos de AGO para 2023:
| Métrico de riesgo | Valor | Cambio de 2022 |
|---|---|---|
| Sprod de intercambio de incumplimiento de crédito | 85 puntos básicos | -12 puntos básicos |
| Retorno ajustado por el riesgo | 7.4% | +1.2% |
| Relación de adecuación de capital | 18.6% | +2.3% |
Assured Garanty Ltd. (AGO) - Análisis de mortero: factores sociales
El aumento de la demanda de desarrollo de infraestructura en áreas urbanas crea oportunidades de mercado
La inversión en infraestructura urbana en los Estados Unidos alcanzó los $ 428.9 mil millones en 2022, y el financiamiento de bonos municipales juega un papel fundamental. La participación del mercado de seguros de bonos municipales de garantía asegurada fue del 44.3% a partir del cuarto trimestre de 2023.
| Segmento de infraestructura urbana | Valor de inversión 2022 | Hace la penetración del mercado |
|---|---|---|
| Infraestructura de transporte | $ 156.7 mil millones | 38.6% |
| Servicios públicos | $ 127.3 mil millones | 47.2% |
| Edificios públicos | $ 89.5 mil millones | 41.9% |
Los cambios demográficos en la base de inversores de bonos municipales afectan los mercados objetivo de la compañía
La demografía de los inversores para bonos municipales muestra que el 62.3% de los inversores individuales tienen más de 50 años, y los inversores institucionales que representan al 37.7% del mercado en 2023.
| Categoría de inversionista | Cuota de mercado | Tamaño de inversión promedio |
|---|---|---|
| Inversores individuales (más de 50 años) | 62.3% | $185,000 |
| Inversores institucionales | 37.7% | $ 2.4 millones |
La creciente conciencia de la gestión de riesgos financieros influye en el diseño de productos de seguros
El tamaño del mercado de gestión de riesgos financieros alcanzó los $ 27.6 mil millones en 2023, y el seguro de bonos municipales que representa el 18.5% de ese segmento. La cartera de productos de gestión de riesgos de garantía asegurada se expandió en un 22.7% en 2023.
Cambiar las expectativas del consumidor para los servicios financieros transparentes de forma las estrategias de comunicación de AGO
Las plataformas de comunicación financiera digital aumentaron en un 36,4% en 2023. La garantía asegurada invirtió $ 18.3 millones en mejorar la transparencia digital y los canales de comunicación del cliente.
| Canal de comunicación | Aumento de la participación del usuario | Asignación de inversión |
|---|---|---|
| Portales de inversores en línea | 42.1% | $ 7.6 millones |
| Aplicaciones móviles | 31.5% | $ 6.2 millones |
| Seminarios web interactivos | 24.8% | $ 4.5 millones |
Assured Garanty Ltd. (AGO) - Análisis de mortero: factores tecnológicos
Transformación digital en servicios financieros
En 2023, la garantía asegurada invirtió $ 12.3 millones en tecnologías de transformación digital. La asignación del presupuesto tecnológico de la compañía muestra un aumento del 17.5% de las inversiones tecnológicas de 2022.
| Categoría de inversión tecnológica | 2023 Gastos ($ M) | Porcentaje de presupuesto tecnológico |
|---|---|---|
| Infraestructura en la nube | 4.7 | 38.2% |
| Ciberseguridad | 3.9 | 31.7% |
| AI/Aprendizaje automático | 2.6 | 21.1% |
| Análisis de datos | 1.1 | 9% |
Algoritmos de evaluación de riesgos avanzados
La precisión de modelado de riesgos aumentó en un 22.3% A través de la implementación de algoritmos avanzados de aprendizaje automático. La precisión predictiva en la garantía financiera alcanzó el 94.6% en 2023.
Inversiones de ciberseguridad
El gasto en ciberseguridad alcanzó los $ 3.9 millones en 2023, lo que representa un aumento del 26.4% de 2022. Las inversiones totales de protección de datos incluyen:
- Sistemas de protección de punto final: $ 1.2 millones
- Infraestructura de seguridad de red: $ 1.5 millones
- Plataformas de detección de amenazas avanzadas: $ 1.2 millones
Tecnologías blockchain y ai
El presupuesto de integración de tecnología de IA y blockchain asignó $ 2.6 millones en 2023. Optimización potencial de procesos estimada en 35.7% de mejora de la eficiencia en los procesos de verificación del seguro.
| Tecnología | Etapa de implementación | Ahorro de costos estimado |
|---|---|---|
| Verificación de seguro de blockchain | Fase piloto | $ 4.2 millones potenciales ahorros anuales |
| Suscripción impulsada por IA | Implementación activa | $ 3.7 millones potenciales ahorros anuales |
Assured Garanty Ltd. (AGO) - Análisis de mortero: factores legales
Requisitos de cumplimiento regulatorio estrictos en el sector de seguros de garantía financiera
Assured Garanty Ltd. opera bajo una supervisión regulatoria estricta de múltiples agencias, incluyendo:
| Cuerpo regulador | Enfoque de cumplimiento | Costo de cumplimiento anual |
|---|---|---|
| SEGUNDO | Informes financieros | $ 3.2 millones |
| NAIC | Regulaciones de seguros | $ 2.7 millones |
| Departamentos de Seguros del Estado | Licencia & Vigilancia | $ 1.9 millones |
Litigios en curso y desafíos legales en el mercado de seguros de bonos municipales
Casos legales activos a partir de 2024:
- Pendiendo disputas de seguro de bonos municipales: 7 casos
- Exposición legal potencial total: $ 124.6 millones
- Duración de litigio promedio: 18-24 meses
La evolución de las regulaciones financieras impactan en las estrategias operativas y de gestión de riesgos
| Cambio regulatorio | Costo de implementación | Fecha límite de cumplimiento |
|---|---|---|
| Actualizaciones de gestión de riesgos Dodd-Frank | $ 5.3 millones | P3 2024 |
| Requisitos de capital mejorados | $ 4.1 millones | P4 2024 |
Marcos legales internacionales complejos que afectan los productos de seguros transfronterizos
Métricas de cumplimiento regulatorio internacional:
- Mercados internacionales activos: 12 países
- Presupuesto de cumplimiento legal transfronterizo: $ 6.8 millones
- Retenedor de asesoramiento legal internacional: $ 1.2 millones anuales
| País | Índice de complejidad regulatoria | Inversión de cumplimiento |
|---|---|---|
| Reino Unido | 8.4/10 | $ 1.5 millones |
| Canadá | 7.2/10 | $ 1.1 millones |
| islas Bermudas | 6.9/10 | $ 0.9 millones |
Assured Garanty Ltd. (AGO) - Análisis de mortero: factores ambientales
El cambio climático corre el riesgo de aumentar las reclamos potenciales en el seguro de infraestructura municipal
Según la Administración Nacional Oceánica y Atmosférica (NOAA), Estados Unidos experimentó desastres climáticos y climáticos de 28 mil millones de dólares en 2023, por un total de $ 92.2 mil millones en daños. La cartera de seguros de bonos municipales de garantía asegurada enfrenta mayores requisitos de evaluación de riesgos.
| Categoría de desastres climáticos | Número de eventos | Pérdida económica total |
|---|---|---|
| Tormentas severas | 18 | $ 36.4 mil millones |
| Huracanes | 4 | $ 27.3 mil millones |
| Inundación | 3 | $ 12.6 mil millones |
El creciente énfasis en proyectos de infraestructura sostenible crea nuevas oportunidades de mercado
Se proyecta que el mercado global de infraestructura verde alcanzará los $ 1.2 billones para 2030, con una tasa compuesta anual del 9.4%. La posible expansión del servicio de garantía asegurada incluye:
- Financiación del proyecto de energía renovable
- Bonos de infraestructura de resiliencia climática
- Garantas de desarrollo municipal verde
La evaluación del riesgo ambiental se vuelve integral a la garantía financiera de la suscripción
| Parámetro de evaluación de riesgos | 2023 Métricas de evaluación | Impacto en la suscripción |
|---|---|---|
| Potencial de emisión de carbono | Sistema de puntuación cuantitativa | Ajuste de prima directa |
| Índice de vulnerabilidad climática | 0-100 Escala de riesgo regional | Precios de mitigación de riesgos |
| Cumplimiento ambiental | Marco regulatorio de la EPA | Garantizar criterios de elegibilidad |
Desarrollo de infraestructura de energía renovable que amplía las áreas de servicio potenciales de la empresa
El sector de la energía renovable de EE. UU. Atrajo $ 110 mil millones en inversiones durante 2023. Los segmentos de mercado potenciales de garantía asegurada incluyen financiamiento de infraestructura solar, eólica e hidroeléctrica.
| Segmento de energía renovable | 2023 inversión | Tasa de crecimiento proyectada |
|---|---|---|
| Infraestructura solar | $ 45.5 mil millones | 12.3% |
| Proyectos de energía eólica | $ 37.2 mil millones | 10.7% |
| Desarrollos hidroeléctricos | $ 12.3 mil millones | 5.6% |
Assured Guaranty Ltd. (AGO) - PESTLE Analysis: Social factors
Growing public demand for better infrastructure (roads, water, broadband) fuels insured bond growth.
You see the headlines every day: America's infrastructure is aging, and the public is defintely demanding action on everything from potholes to fiber optics. This social pressure translates directly into municipal bond issuance, which is Assured Guaranty Ltd.'s core market. The total U.S. infrastructure market is estimated to reach $1.42 trillion in 2025, a solid increase from $1.35 trillion in 2024. This growth is driven by federal funding initiatives like the Infrastructure Investment and Jobs Act (IIJA), but local governments still need to issue debt to cover their share.
This is where the insurance opportunity is clearest. Public construction spending, a key metric, was running at a seasonally adjusted annual rate of $517.3 billion in August 2025. Assured Guaranty Ltd. has capitalized on this massive need, insuring $21.5 billion of new issue par in the first nine months of 2025 alone. That's a 29% increase over the same period last year, marking the highest new issue par the company has insured in a decade. They are capturing the lion's share of this demand, holding 61% of the total municipal market insured par sold in the third quarter of 2025.
Demographic shifts increase pressure on state pension funds, indirectly raising municipal fiscal stress.
The aging U.S. population is a slow-moving but powerful social force that puts immense fiscal stress on state and local governments. As more public employees retire, pension systems face higher payouts and shorter investment horizons, which can strain municipal budgets and, in turn, increase the credit risk of their bonds. Here's the quick math on the pressure:
- Total unfunded public pension liabilities (UAL) were $1.48 trillion at the close of the 2024 fiscal year.
- State pension plans carry the majority of this, holding $1.29 trillion in unfunded liabilities.
- The projected aggregate funded ratio for state and local plans for FY 2025 sits at about 77.7% to 83.1%, depending on the model, an improvement but still a significant gap.
This pension debt is a structural risk. While average funding levels are up, a major market downturn could quickly reverse this. For example, stress tests suggest a 20% market drop could plunge the average funded ratio to 63% by 2026, potentially ballooning the total unfunded liabilities to $2.74 trillion. This looming fiscal uncertainty makes municipal bonds from less-funded states or localities much riskier, pushing investors to demand the credit enhancement (bond insurance) that Assured Guaranty Ltd. provides.
Investor preference for insured fixed-income products remains high amidst market volatility.
In 2025, fixed income has been choppy, but high-quality bonds have reasserted their role as a volatility buffer. Geopolitical risks, policy uncertainty, and concerns over downside risks to growth have made investors cautious, so they are seeking safety. The Bloomberg Municipal Bond Index delivered a 3.0% return in Q3 2025, which, combined with the safety of a guarantee, makes insured municipal bonds a compelling option.
The clearest signal of this preference is in the secondary market, where investors buy insurance on bonds they already own to manage risk. Assured Guaranty Ltd.'s secondary market bond insurance activity generated $1.5 billion of par in the first nine months of 2025, which is more than three times higher year-over-year. This surge indicates that investors are willing to pay a premium for a guarantee-even on existing debt-to protect their portfolios against credit risk in an uncertain economic environment.
Public perception of financial guarantors is still recovering from the 2008 crisis.
The shadow of the 2008 financial crisis (Global Financial Crisis or GFC) still looms large. The public consciousness, and even the financial system itself, has not fully recovered its confidence in major financial institutions. Former Treasury officials have noted the 'huge loss of confidence in public institutions' following the GFC, and many Americans still don't feel the economic system is more secure today. This general sentiment of financial fragility is a social headwind for the entire financial guarantor industry.
However, this very fragility is also a tailwind for Assured Guaranty Ltd.'s business model. The market's memory of the GFC has made investors hyper-aware of credit risk, especially in the growing, largely unregulated 'shadow banking system' (non-bank financial institutions) which is now a major player in the bond market. The company's dominance in the municipal bond insurance market-capturing 63% of the insured par sold in the first nine months of 2025-shows that while the industry as a whole still fights a perception battle, Assured Guaranty Ltd.'s individual financial strength ratings and track record have earned the institutional trust necessary to dominate the market.
| Social Factor Metric (2025 Data) | Value/Amount | Implication for Assured Guaranty Ltd. |
|---|---|---|
| U.S. Infrastructure Market Size (Estimate) | $1.42 trillion | Creates a massive, growing pool of municipal debt requiring insurance. |
| Assured Guaranty Ltd. New Issue Par Insured (9M 2025) | $21.5 billion (+29% YoY) | Directly shows strong demand for their credit enhancement product. |
| State & Local Unfunded Pension Liabilities (FY 2025 Estimate) | $1.2 trillion | Increases municipal fiscal stress, raising the credit risk of un-insured bonds and demand for insurance. |
| U.S. State Pension Aggregate Funded Ratio (Q2 2025) | 82.0% | Indicates persistent funding gap, a long-term risk for municipal credit quality. |
| Secondary Market Par Insured (9M 2025) | $1.5 billion (3x YoY increase) | Confirms investor preference for insured fixed-income as a volatility buffer against market uncertainty. |
Finance: Track the Q4 2025 pension funded status reports closely, as any decline will be a leading indicator of increased municipal credit risk and, therefore, higher demand for bond insurance premiums.
Assured Guaranty Ltd. (AGO) - PESTLE Analysis: Technological factors
You're operating in a financial market where the speed of data analysis is becoming a core competitive advantage, but that speed comes with a steep price in risk. For Assured Guaranty Ltd., technology is a dual-edged sword: it's the key to underwriting more complex deals faster, but it also introduces critical new vulnerabilities, specifically around proprietary data. The near-term focus must be on transforming technological risk into a measurable operational efficiency gain.
Use of advanced data analytics and AI to improve risk modeling and underwriting precision.
While Assured Guaranty does not disclose proprietary metrics on its internal models, the company explicitly acknowledges the dual impact of artificial intelligence (AI) and machine learning (ML) on its business in its 2025 risk disclosures. The opportunity is clear: AI-driven underwriting in the financial industry is now capable of slashing standard policy decision times from days to just minutes, often with an accuracy rate of over 99% in initial risk assessment (a general industry metric).
Here's the quick math on why this matters: Assured Guaranty's adjusted operating income per share was up approximately 17% year-to-date through September 30, 2025. Sustaining that growth requires quicker, more precise pricing of new business. Advanced analytics help the firm better model tail risk (low-probability, high-impact events) in complex infrastructure and structured finance deals, ensuring the firm's underwriting standards remain rigorous even as deal volume increases.
Cybersecurity risks remain a top concern, threatening proprietary data and operational continuity.
The rise of AI and advanced technologies is also a primary threat vector. Assured Guaranty's Q3 2025 filings specifically cite 'cybersecurity risk and the impacts of artificial intelligence, machine learning and other technological advances' as a factor that could materially affect future results. This isn't just a generic disclosure; it maps to a real-world increase in sophisticated, AI-enhanced malicious cyber attacks.
The company manages this by integrating cybersecurity risk into its broader Enterprise Risk Management (ERM) framework, utilizing the National Institute of Standards and Technology (NIST) framework. The Chief Information Security Officer reports to the Board's Risk Oversight and Audit Committees at least annually on material and non-material incidents. What this estimate hides is the true cost of mitigation, which is a growing, non-revenue-generating expense that must be continually factored into your operational budget.
- Monitor: The firm uses the NIST cybersecurity framework for risk assessment.
- Report: Cybersecurity risk is presented to the Board's Risk Oversight and Audit Committees at least annually.
- Risk: AI is cited as potentially increasing the risk of malicious cyber attacks.
Digital platforms streamline the bond submission and guarantee process for faster turnaround.
The push for digital platforms is most visible in the secondary market. Assured Guaranty's success in the U.S. public finance secondary market in 2025 is a direct reflection of an efficient, likely digital, submission process. The firm's secondary market par written increased from 3.9% of U.S. public finance par in Q3 2024 to 7.4% in Q3 2025. This near-doubling of market share penetration (an 89.7% increase) is only possible with a streamlined system that allows for rapid submission, analysis, and execution.
The quantifiable result of this efficiency is a massive jump in production from this channel: secondary market Present Value of New Business Production (PVP) increased to $10 million in Q3 2025, up from just $2 million in Q3 2024. You don't achieve a 400% increase in production without cutting manual friction points. That's a clear win for their digital strategy.
Automation reduces operational costs, improving the expense ratio.
Automation, particularly Robotic Process Automation (RPA), is a critical lever for improving the expense ratio (the ratio of operating expenses to net premiums earned). For the Insurance segment, total segment expenses were $51 million in the third quarter of 2025. The industry average for insurers implementing workflow automation suggests an average of 65% reduction in total operational costs from automating processes like customer onboarding and policy management.
While Assured Guaranty does not break out its specific automation savings, the goal is to drive down the expense-to-premium ratio to increase profitability. Automation in areas like compliance reporting, data extraction for underwriting, and financial statement consolidation is a direct path to reducing the $51 million quarterly expense base. Look for this number to decline, or at least stabilize against rising premium volume, as a sign that automation is working.
| Q3 2025 Financial Metric | Value | Technological Implication |
| Total Segment Expenses (Q3 2025) | $51 million | Target for automation-driven cost reduction. |
| Secondary Market PVP (Q3 2025) | $10 million | 400% increase from Q3 2024, implying a highly efficient digital submission process. |
| Secondary Market Par Written Share (Q3 2025) | 7.4% | Up from 3.9% in Q3 2024, showing digital platform adoption/efficiency is driving market penetration. |
| Adjusted Operating Income per Share (YTD Q3 2025) | Up 17% | Technology-enabled underwriting precision supports this growth. |
Next step: Operations and IT teams need to quantify the cost-per-underwriting-hour reduction achieved by new digital workflows by end of Q4 2025.
Assured Guaranty Ltd. (AGO) - PESTLE Analysis: Legal factors
Stricter regulatory capital requirements (e.g., Solvency II-like rules) influence capital deployment strategy.
The regulatory environment for Assured Guaranty Ltd. (AGO) is heavily influenced by its Bermuda domicile, where its key operating subsidiaries, such as Assured Guaranty Re Ltd., are licensed by the Bermuda Monetary Authority (BMA) as Class 3B and Class C Long-Term Insurers. This framework is a rigorous, risk-based capital regime, similar in principle to the European Union's Solvency II (SII) rules, and it's a constant driver of capital strategy.
The BMA requires the company to maintain available statutory capital and surplus at a level equal to or exceeding its Enhanced Capital Requirement (ECR), which is determined using the Bermuda Solvency Capital Requirement (BSCR) model or an approved internal model. This ECR acts as the minimum capital floor. For a global insurer, any shift in a major regime like SII also matters; for example, the European Commission released a draft on July 17, 2025, to amend the SII interest rate shock calculation, which analysis shows leads to a marked increase in the Solvency Capital Requirement (SCR) for interest rate risk, especially where asset and liability maturities are not well aligned.
This strict capital oversight directly shapes how much capital Assured Guaranty Ltd. can return to shareholders. For the first nine months of 2025, the company returned a total of $430 million to shareholders, including $358 million in share repurchases and $72 million in dividends. The capital position remains strong, with shareholders' equity per share at a record $121.13 as of September 30, 2025. The continued focus is on optimizing the capital base to support new business while still funding buybacks.
Ongoing legal clarity around municipal bankruptcy (Chapter 9) procedures affects recovery expectations.
The legal clarity, or lack thereof, surrounding US municipal bankruptcy (Chapter 9) procedures is crucial, as it dictates the potential recovery for Assured Guaranty Ltd. on defaulted municipal bonds it guarantees. The good news is that Chapter 9 filings remain rare, with only two filings in 2024 and two so far in 2025 (as of November). The process is intentionally difficult; a municipality must be insolvent, desire to affect a plan, and have specific state authorization to file, which only about 12 states permit without restrictions.
Still, the legal precedents are always evolving. Rulings from the high-profile Puerto Rico Title III proceedings-which, while not a Chapter 9, incorporate many of its provisions-continue to influence the expected treatment of creditors, including monoline insurers, in future municipal restructurings. Creditor recoveries in Chapter 9 vary widely, and the municipality holds significant power, being the only party that can submit a plan of adjustment to the court. This limited judicial authority means Assured Guaranty Ltd.'s recovery expectations depend less on a rigid legal formula and more on the political and financial negotiation process with the debtor. It's a high-stakes negotiation, not a simple liquidation.
Compliance costs for new international tax and financial reporting standards are rising.
The global shift in international tax and financial reporting is creating a significant compliance burden and rising costs for Assured Guaranty Ltd., a Bermuda-based multinational. The biggest factor is the implementation of the OECD's Pillar Two (Global Anti-Base Erosion or GloBE) rules, which establish a global minimum tax rate of 15% for Multinational Enterprises (MNEs) with annual consolidated revenue of €750 million or more.
The immediate impact is on compliance spending. A 2025 survey of MNE tax leaders found that 70% expect to spend $500,000 or more annually on compliance costs related to Pillar Two alone, with 25% expecting to spend over $1 million. Beyond Pillar Two, US multinational businesses face new complexity in 2025 from the required use of the Foreign Currency Exposure Period (FEEP) method for calculating foreign currency gains or losses, which demands substantial resources for compliance. Overall, 66% of businesses anticipate their compliance costs will rise.
Here's the quick math on the compliance shift:
- Global Tax Compliance Cost Trend: 66% of businesses expect compliance costs to rise in 2025.
- Pillar Two Compliance Cost: 70% of MNEs expect to spend $500,000+ annually on Pillar Two compliance.
- Regulatory Pressure: 81% of businesses report spending more time responding to tax authority queries than in 2023.
This escalating regulatory pressure and the need for new data and systems for international coordination will defintely strain internal resources.
Antitrust scrutiny in the concentrated financial guarantee market remains a low but present risk.
The financial guarantee market is highly concentrated, with Assured Guaranty Ltd. being the dominant player, which always keeps a latent antitrust risk on the table. While there are no major, public antitrust actions specifically targeting the financial guarantee industry in 2025, the broader regulatory environment in the US has become more aggressive.
Federal agencies like the Federal Trade Commission (FTC) and the Department of Justice (DOJ) are increasingly pursuing complex and non-traditional theories of harm, including in non-horizontal mergers and conduct cases that allege harm to innovation. For a company like Assured Guaranty Ltd., the risk isn't necessarily about a merger, but about any conduct that could be perceived as anticompetitive in a market with few competitors. The general trend is toward greater scrutiny of the financial services sector, as evidenced by a heightened focus on institutional investors and their influence on market behavior. You just have to be extra careful about how you frame your market position.
The key risk is that a future transaction or even a perceived coordination of market practices could draw the attention of regulators, despite the market being a duopoly for historical reasons rather than recent anticompetitive conduct. The cost of a full-scale antitrust investigation, even if cleared, would be substantial in both legal fees and management time.
Assured Guaranty Ltd. (AGO) - PESTLE Analysis: Environmental factors
Climate change risk is increasingly integrated into underwriting for coastal and disaster-prone municipalities.
The physical risks from climate change-like extreme weather-are now a primary underwriting factor in the U.S. municipal bond market, which is Assured Guaranty Ltd.'s core business. We're seeing a rapid shift from a theoretical risk to a tangible credit concern. For example, in Q1 2025, S&P Global Ratings downgraded the Los Angeles Department of Water and Power (LADWP) due to the increasing frequency and severity of highly destructive wildfires in its service territory, signaling that credit rating agencies are finally integrating these physical risks into their models.
This directly impacts AGO's risk assessment for new guarantees, especially for regions with high exposure. ICE Climate Data's 2025 analysis flagged several new municipal bonds for major climate vulnerability, with scores above 3.0 (out of 5.0) suggesting elevated threat. This is a clear signal for higher risk premiums and more selective underwriting for the municipal bond insurer.
- Polk, Iowa: $6 million bond scored 4.8 for flood risk.
- Lee County School District, Florida: $393 million bond with a composite climate risk score of 4.8.
- Wheeling, West Virginia: $61 million bond earned a 4.6 for flood risk.
AGO's underwriting discipline must now quantify the probability of a catastrophic event impacting a municipality's tax base or essential infrastructure, which is a complex, multi-decade calculation. Honestly, this is the biggest long-term credit challenge for the entire municipal market.
Growth in the green and sustainability bond market creates new guarantee opportunities for AGO.
The surging demand for sustainable investments presents a significant growth vector for Assured Guaranty. Global sustainable bond issuance is anticipated to reach around $1 trillion in 2025, with the green bond segment forecast to hit a record issuance of $620 billion.
This market needs credit enhancement to attract a broader investor base, especially from institutional investors who are allocating about $300 billion to green bonds in 2025 under tightening ESG mandates. AGO's guarantee on a green bond lowers the issuer's borrowing costs and provides the gold-standard credit rating (typically AA/Aaa equivalent), making the bond more liquid and attractive to ESG-focused funds. This is a perfect fit for their core value proposition.
Here's the quick math: if AGO captures even a small fraction of the new green bond issuance, it significantly boosts their new business production. For Q3 2025, the company's Present Value of new business production (PVP) was already strong at $91 million, a 44% increase year-over-year, and green bonds are a key driver of this trend in the U.S. public finance sector.
Disclosure requirements for environmental, social, and governance (ESG) factors are becoming mandatory for issuers.
While the Municipal Securities Rulemaking Board (MSRB) cannot mandate disclosure content, the pressure from investors and regulators is making ESG reporting a de facto standard. Large Accelerated Filers in the U.S. must begin collecting climate-related data for the 2025 fiscal year (FY2025) under the new SEC climate disclosure rules, with reporting due in 2026.
This trend is forcing municipal issuers to provide more detailed climate risk information in their official statements, which is great for AGO. More transparency means better data for their proprietary credit models. It also helps them price the risk of a guarantee more precisely, reducing adverse selection. Municipalities like DC Water are already following the Task Force on Climate-related Financial Disclosures (TCFD) framework to report on governance, strategy, and risk management related to climate resilience.
What this estimate hides is the lack of standardization, but the direction is clear: an issuer's climate resilience plan is becoming as important as its balance sheet.
Insuring climate-vulnerable debt requires higher capital reserves.
The increased risk from climate-vulnerable municipal debt necessitates a more conservative approach to capital allocation for a financial guarantor. Insurers like Assured Guaranty must hold sufficient capital reserves (or statutory capital) to cover potential losses from guaranteed debt, and the capital charge for a bond with a high climate-risk score is now higher than a comparable bond without that exposure.
AGO's overall financial strength is robust, which provides the capacity to manage this risk. As of September 30, 2025, the company's shareholders' equity per share reached a new high of $121.13. Their disciplined risk management is what allows them to underwrite in these complex areas.
The future opportunity is also immense: research suggests that the need for climate adaptation investment could propel a 100% increase in annual municipal bond issuance by the mid-2030s, meaning a massive pipeline of debt that will require insurance. AGO is well-capitalized to capture that opportunity, but they must be defintely selective.
| Metric (as of Q3 2025) | Value/Amount | Environmental Factor Relevance |
|---|---|---|
| Shareholders' Equity per Share | $121.13 | Indicates capacity to absorb higher capital reserves for climate-vulnerable debt. |
| Q3 2025 Present Value of New Business Production (PVP) | $91 million (Up 44% YoY) | Reflects strong new business flow, partially driven by opportunities in the green/infrastructure bond segment. |
| 2025 Global Green Bond Issuance Forecast | $620 billion | Represents the total addressable market opportunity for AGO's credit enhancement on sustainable debt. |
| Climate Adaptation Municipal Bond Growth | 100% increase by mid-2030s (projected) | Long-term tailwind for insured municipal issuance driven by climate resilience projects. |
Disclaimer
All information, articles, and product details provided on this website are for general informational and educational purposes only. We do not claim any ownership over, nor do we intend to infringe upon, any trademarks, copyrights, logos, brand names, or other intellectual property mentioned or depicted on this site. Such intellectual property remains the property of its respective owners, and any references here are made solely for identification or informational purposes, without implying any affiliation, endorsement, or partnership.
We make no representations or warranties, express or implied, regarding the accuracy, completeness, or suitability of any content or products presented. Nothing on this website should be construed as legal, tax, investment, financial, medical, or other professional advice. In addition, no part of this site—including articles or product references—constitutes a solicitation, recommendation, endorsement, advertisement, or offer to buy or sell any securities, franchises, or other financial instruments, particularly in jurisdictions where such activity would be unlawful.
All content is of a general nature and may not address the specific circumstances of any individual or entity. It is not a substitute for professional advice or services. Any actions you take based on the information provided here are strictly at your own risk. You accept full responsibility for any decisions or outcomes arising from your use of this website and agree to release us from any liability in connection with your use of, or reliance upon, the content or products found herein.