
|
Valoración DCF de Adecoagro S.A. (AGRO) |
Completamente Editable: Adáptelo A Sus Necesidades En Excel O Sheets
Diseño Profesional: Plantillas Confiables Y Estándares De La Industria
Predeterminadas Para Un Uso Rápido Y Eficiente
Compatible con MAC / PC, completamente desbloqueado
No Se Necesita Experiencia; Fáciles De Seguir
Adecoagro S.A. (AGRO) Bundle
¡Optimice su tiempo y mejore la precisión con nuestra calculadora DCF (agro)! Equipado con datos de Adecoagro S.A. actualizados y suposiciones personalizables, esta herramienta le permite pronosticar, analizar y evaluar Adecoagro S.A. como un inversor experimentado.
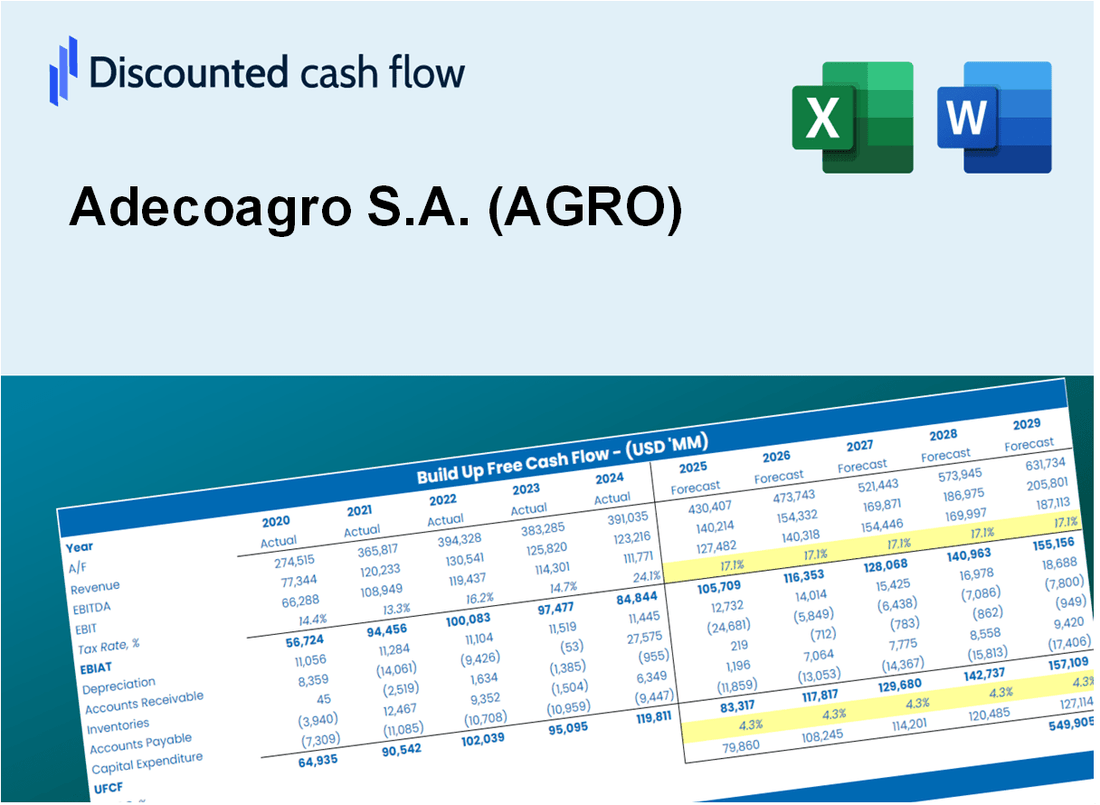
Discounted Cash Flow (DCF) - (USD MM)
| Year | AY1 2020 |
AY2 2021 |
AY3 2022 |
AY4 2023 |
AY5 2024 |
FY1 2025 |
FY2 2026 |
FY3 2027 |
FY4 2028 |
FY5 2029 |
|---|---|---|---|---|---|---|---|---|---|---|
| Revenue | 817.8 | 1,124.4 | 1,347.7 | 1,298.9 | 1,518.9 | 1,787.3 | 2,103.1 | 2,474.6 | 2,911.9 | 3,426.3 |
| Revenue Growth, % | 0 | 37.49 | 19.87 | -3.62 | 16.94 | 17.67 | 17.67 | 17.67 | 17.67 | 17.67 |
| EBITDA | 245.4 | 453.2 | 397.6 | 651.6 | 426.4 | 636.5 | 749.0 | 881.3 | 1,037.0 | 1,220.3 |
| EBITDA, % | 30.01 | 40.31 | 29.51 | 50.17 | 28.07 | 35.61 | 35.61 | 35.61 | 35.61 | 35.61 |
| Depreciation | 156.5 | 186.7 | 172.1 | 274.1 | 224.4 | 301.6 | 354.9 | 417.7 | 491.4 | 578.3 |
| Depreciation, % | 19.13 | 16.61 | 12.77 | 21.1 | 14.77 | 16.88 | 16.88 | 16.88 | 16.88 | 16.88 |
| EBIT | 89.0 | 266.5 | 225.5 | 377.5 | 202.0 | 334.9 | 394.0 | 463.7 | 545.6 | 642.0 |
| EBIT, % | 10.88 | 23.7 | 16.73 | 29.06 | 13.3 | 18.74 | 18.74 | 18.74 | 18.74 | 18.74 |
| Total Cash | 336.3 | 199.8 | 230.7 | 339.8 | 211.2 | 414.9 | 488.2 | 574.5 | 676.0 | 795.4 |
| Total Cash, percent | .0 | .0 | .0 | .0 | .0 | .0 | .0 | .0 | .0 | .0 |
| Account Receivables | 117.4 | 117.3 | 132.6 | 129.3 | 159.3 | 196.9 | 231.7 | 272.6 | 320.8 | 377.5 |
| Account Receivables, % | 14.36 | 10.44 | 9.84 | 9.95 | 10.49 | 11.02 | 11.02 | 11.02 | 11.02 | 11.02 |
| Inventories | 284.4 | 415.3 | 509.8 | 460.4 | 540.2 | 645.4 | 759.5 | 893.6 | 1,051.5 | 1,237.3 |
| Inventories, % | 34.78 | 36.94 | 37.83 | 35.44 | 35.56 | 36.11 | 36.11 | 36.11 | 36.11 | 36.11 |
| Accounts Payable | 110.7 | 152.0 | 193.1 | 140.9 | 173.2 | 227.5 | 267.6 | 314.9 | 370.6 | 436.0 |
| Accounts Payable, % | 13.53 | 13.52 | 14.33 | 10.85 | 11.4 | 12.73 | 12.73 | 12.73 | 12.73 | 12.73 |
| Capital Expenditure | -177.0 | -213.0 | -230.2 | -243.4 | -263.3 | -335.1 | -394.3 | -464.0 | -546.0 | -642.4 |
| Capital Expenditure, % | -21.64 | -18.94 | -17.08 | -18.74 | -17.34 | -18.75 | -18.75 | -18.75 | -18.75 | -18.75 |
| Tax Rate, % | -163.18 | -163.18 | -163.18 | -163.18 | -163.18 | -163.18 | -163.18 | -163.18 | -163.18 | -163.18 |
| EBITAT | 7.1 | 199.5 | 180.2 | 279.7 | 531.7 | 225.6 | 265.5 | 312.4 | 367.5 | 432.5 |
| Depreciation | ||||||||||
| Changes in Account Receivables | ||||||||||
| Changes in Inventories | ||||||||||
| Changes in Accounts Payable | ||||||||||
| Capital Expenditure | ||||||||||
| UFCF | -304.6 | 83.7 | 53.5 | 311.0 | 415.1 | 103.6 | 117.4 | 138.2 | 162.6 | 191.3 |
| WACC, % | 5.45 | 5.72 | 5.74 | 5.72 | 5.82 | 5.69 | 5.69 | 5.69 | 5.69 | 5.69 |
| PV UFCF | ||||||||||
| SUM PV UFCF | 595.7 | |||||||||
| Long Term Growth Rate, % | 1.00 | |||||||||
| Free cash flow (T + 1) | 193 | |||||||||
| Terminal Value | 4,122 | |||||||||
| Present Terminal Value | 3,126 | |||||||||
| Enterprise Value | 3,722 | |||||||||
| Net Debt | 910 | |||||||||
| Equity Value | 2,811 | |||||||||
| Diluted Shares Outstanding, MM | 2,577 | |||||||||
| Equity Value Per Share | 1.09 |
What You Will Get
- Real AGRO Financial Data: Pre-filled with Adecoagro’s historical and projected data for precise analysis.
- Fully Editable Template: Modify key inputs like revenue growth, WACC, and EBITDA % with ease.
- Automatic Calculations: See Adecoagro’s intrinsic value update instantly based on your changes.
- Professional Valuation Tool: Designed for investors, analysts, and consultants seeking accurate DCF results.
- User-Friendly Design: Simple structure and clear instructions for all experience levels.
Key Features
- Customizable Financial Inputs: Adjust essential parameters such as crop yields, market prices, and operational costs.
- Instant DCF Valuation: Quickly computes intrinsic value, NPV, and other financial metrics.
- High Precision Forecasts: Leverages Adecoagro’s real-world data for accurate valuation results.
- Effortless Scenario Testing: Easily evaluate various assumptions and analyze different outcomes.
- Efficiency Booster: Avoid the hassle of creating intricate valuation models from the ground up.
How It Works
- Step 1: Download the Excel file for Adecoagro S.A. (AGRO).
- Step 2: Review Adecoagro’s pre-filled financial data and forecasts.
- Step 3: Modify key inputs such as revenue growth, WACC, and tax rates (highlighted cells).
- Step 4: Observe the DCF model update in real-time as you adjust your assumptions.
- Step 5: Analyze the results and utilize the outputs for informed investment decisions.
Why Choose This Calculator for Adecoagro S.A. (AGRO)?
- User-Friendly Interface: Perfectly suited for both novices and seasoned analysts.
- Customizable Inputs: Easily adjust parameters to align with your specific analysis.
- Real-Time Valuation: Instantly observe changes to Adecoagro’s valuation as you modify inputs.
- Pre-Loaded Data: Comes with Adecoagro’s actual financial information for swift evaluations.
- Relied Upon by Experts: Utilized by investors and analysts for making well-informed decisions.
Who Should Use This Product?
- Investors: Evaluate Adecoagro S.A. (AGRO) to make informed stock trading decisions.
- CFOs and Financial Analysts: Optimize valuation methods and assess financial forecasts.
- Startup Founders: Gain insights into how agricultural companies like Adecoagro are valued.
- Consultants: Provide detailed valuation analyses for agricultural sector clients.
- Students and Educators: Utilize actual market data to learn and teach valuation strategies.
What the Template Contains
- Pre-Filled Data: Includes Adecoagro S.A.'s historical financials and forecasts.
- Discounted Cash Flow Model: Editable DCF valuation model with automatic calculations.
- Weighted Average Cost of Capital (WACC): A dedicated sheet for calculating WACC based on custom inputs.
- Key Financial Ratios: Analyze Adecoagro S.A.'s profitability, efficiency, and leverage.
- Customizable Inputs: Edit revenue growth, margins, and tax rates with ease.
- Clear Dashboard: Charts and tables summarizing key valuation results.
Disclaimer
All information, articles, and product details provided on this website are for general informational and educational purposes only. We do not claim any ownership over, nor do we intend to infringe upon, any trademarks, copyrights, logos, brand names, or other intellectual property mentioned or depicted on this site. Such intellectual property remains the property of its respective owners, and any references here are made solely for identification or informational purposes, without implying any affiliation, endorsement, or partnership.
We make no representations or warranties, express or implied, regarding the accuracy, completeness, or suitability of any content or products presented. Nothing on this website should be construed as legal, tax, investment, financial, medical, or other professional advice. In addition, no part of this site—including articles or product references—constitutes a solicitation, recommendation, endorsement, advertisement, or offer to buy or sell any securities, franchises, or other financial instruments, particularly in jurisdictions where such activity would be unlawful.
All content is of a general nature and may not address the specific circumstances of any individual or entity. It is not a substitute for professional advice or services. Any actions you take based on the information provided here are strictly at your own risk. You accept full responsibility for any decisions or outcomes arising from your use of this website and agree to release us from any liability in connection with your use of, or reliance upon, the content or products found herein.