
|
Arkema S.A. (Ake.PA) Valoración de DCF |
Completamente Editable: Adáptelo A Sus Necesidades En Excel O Sheets
Diseño Profesional: Plantillas Confiables Y Estándares De La Industria
Predeterminadas Para Un Uso Rápido Y Eficiente
Compatible con MAC / PC, completamente desbloqueado
No Se Necesita Experiencia; Fáciles De Seguir
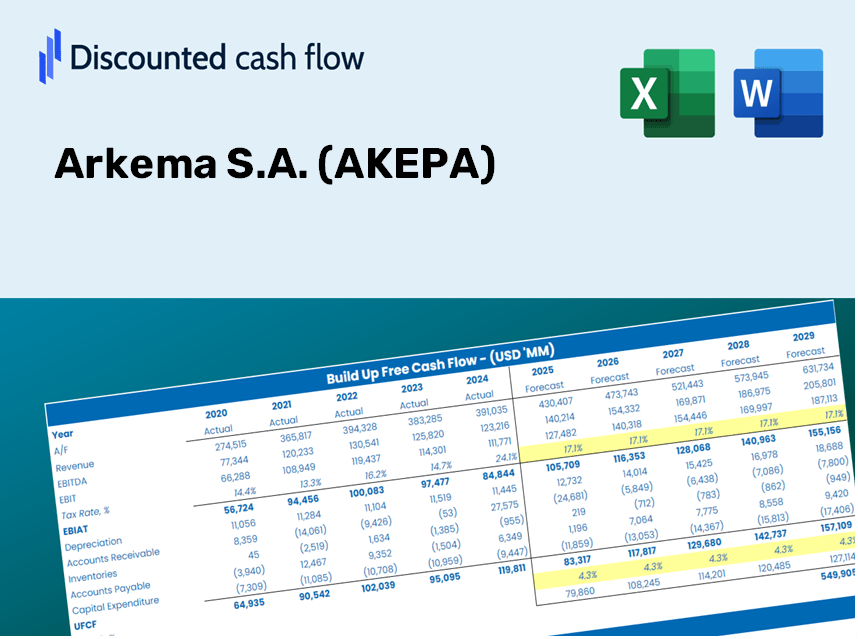
Arkema S.A. (AKE.PA) Bundle
¿Busca evaluar el valor intrínseco de Arkema S.A.? Nuestra calculadora DCF (AKEPA) integra datos del mundo real con características integrales de personalización, lo que le permite refinar sus pronósticos y mejorar su toma de decisiones de inversión.
Discounted Cash Flow (DCF) - (USD MM)
| Year | AY1 2020 |
AY2 2021 |
AY3 2022 |
AY4 2023 |
AY5 2024 |
FY1 2025 |
FY2 2026 |
FY3 2027 |
FY4 2028 |
FY5 2029 |
|---|---|---|---|---|---|---|---|---|---|---|
| Revenue | 7,884.0 | 9,519.0 | 11,550.0 | 9,514.0 | 9,544.0 | 10,134.8 | 10,762.2 | 11,428.5 | 12,135.9 | 12,887.2 |
| Revenue Growth, % | 0 | 20.74 | 21.34 | -17.63 | 0.31532 | 6.19 | 6.19 | 6.19 | 6.19 | 6.19 |
| EBITDA | 1,187.0 | 2,269.0 | 1,820.0 | 1,326.0 | 1,306.0 | 1,667.6 | 1,770.8 | 1,880.5 | 1,996.9 | 2,120.5 |
| EBITDA, % | 15.06 | 23.84 | 15.76 | 13.94 | 13.68 | 16.45 | 16.45 | 16.45 | 16.45 | 16.45 |
| Depreciation | 614.0 | 543.0 | 550.0 | 690.0 | 769.0 | 680.3 | 722.4 | 767.2 | 814.7 | 865.1 |
| Depreciation, % | 7.79 | 5.7 | 4.76 | 7.25 | 8.06 | 6.71 | 6.71 | 6.71 | 6.71 | 6.71 |
| EBIT | 573.0 | 1,726.0 | 1,270.0 | 636.0 | 537.0 | 987.3 | 1,048.4 | 1,113.3 | 1,182.2 | 1,255.4 |
| EBIT, % | 7.27 | 18.13 | 11 | 6.68 | 5.63 | 9.74 | 9.74 | 9.74 | 9.74 | 9.74 |
| Total Cash | 1,627.0 | 2,285.0 | 1,592.0 | 2,045.0 | 2,013.0 | 2,047.5 | 2,174.2 | 2,308.8 | 2,451.7 | 2,603.5 |
| Total Cash, percent | .0 | .0 | .0 | .0 | .0 | .0 | .0 | .0 | .0 | .0 |
| Account Receivables | 1,192.0 | 1,629.0 | 1,447.0 | 1,334.0 | 1,404.0 | 1,489.7 | 1,581.9 | 1,679.8 | 1,783.8 | 1,894.2 |
| Account Receivables, % | 15.12 | 17.11 | 12.53 | 14.02 | 14.71 | 14.7 | 14.7 | 14.7 | 14.7 | 14.7 |
| Inventories | 881.0 | 1,284.0 | 1,399.0 | 1,208.0 | 1,348.0 | 1,289.1 | 1,368.9 | 1,453.6 | 1,543.6 | 1,639.2 |
| Inventories, % | 11.17 | 13.49 | 12.11 | 12.7 | 14.12 | 12.72 | 12.72 | 12.72 | 12.72 | 12.72 |
| Accounts Payable | 987.0 | 1,274.0 | 1,149.0 | 1,036.0 | 1,074.0 | 1,175.5 | 1,248.3 | 1,325.5 | 1,407.6 | 1,494.7 |
| Accounts Payable, % | 12.52 | 13.38 | 9.95 | 10.89 | 11.25 | 11.6 | 11.6 | 11.6 | 11.6 | 11.6 |
| Capital Expenditure | -605.0 | -763.0 | -730.0 | -634.0 | -768.0 | -744.3 | -790.4 | -839.3 | -891.3 | -946.4 |
| Capital Expenditure, % | -7.67 | -8.02 | -6.32 | -6.66 | -8.05 | -7.34 | -7.34 | -7.34 | -7.34 | -7.34 |
| Tax Rate, % | 30.18 | 30.18 | 30.18 | 30.18 | 30.18 | 30.18 | 30.18 | 30.18 | 30.18 | 30.18 |
| EBITAT | 370.8 | 1,348.1 | 1,004.5 | 424.7 | 374.9 | 707.9 | 751.7 | 798.3 | 847.7 | 900.2 |
| Depreciation | ||||||||||
| Changes in Account Receivables | ||||||||||
| Changes in Inventories | ||||||||||
| Changes in Accounts Payable | ||||||||||
| Capital Expenditure | ||||||||||
| UFCF | -706.2 | 575.1 | 766.5 | 671.7 | 203.9 | 718.7 | 584.5 | 620.7 | 659.2 | 700.0 |
| WACC, % | 5.09 | 5.35 | 5.37 | 5.13 | 5.19 | 5.22 | 5.22 | 5.22 | 5.22 | 5.22 |
| PV UFCF | ||||||||||
| SUM PV UFCF | 2,824.1 | |||||||||
| Long Term Growth Rate, % | 2.00 | |||||||||
| Free cash flow (T + 1) | 714 | |||||||||
| Terminal Value | 22,152 | |||||||||
| Present Terminal Value | 17,174 | |||||||||
| Enterprise Value | 19,998 | |||||||||
| Net Debt | 2,541 | |||||||||
| Equity Value | 17,457 | |||||||||
| Diluted Shares Outstanding, MM | 75 | |||||||||
| Equity Value Per Share | 232.13 |
What You'll Receive
- Genuine AKEPA Financial Data: Pre-loaded with Arkema S.A.’s historical and projected figures for accurate analysis.
- Completely Adjustable Template: Easily modify essential inputs such as revenue growth, WACC, and EBITDA percentage.
- Instant Calculations: Watch Arkema S.A.’s intrinsic value refresh in real-time as you make adjustments.
- Expert Valuation Tool: Tailored for investors, analysts, and consultants focused on obtaining precise DCF outcomes.
- Intuitive Layout: Clear structure and straightforward instructions suitable for all skill levels.
Primary Features
- Comprehensive Historical Data: Access Arkema S.A.'s historical financial reports and pre-filled projections.
- Customizable Parameters: Modify WACC, tax rates, revenue growth, and EBITDA margins as needed.
- Real-Time Feedback: Observe the recalculation of Arkema S.A.'s intrinsic value instantly.
- Intuitive Visual Representations: Dashboard charts illustrate valuation outcomes and essential metrics.
- Designed for Precision: A specialized tool tailored for analysts, investors, and finance professionals.
Understanding the Process
- Download: Obtain the pre-prepared Excel file featuring Arkema S.A. (AKEPA) financial data.
- Customize: Modify forecasts such as revenue growth, EBITDA percentage, and WACC to fit your analysis.
- Real-Time Updates: Intrinsic value and NPV calculations refresh automatically as you make adjustments.
- Scenario Testing: Generate multiple projections and instantly compare the results.
- Informed Decisions: Leverage the valuation findings to shape your investment approach.
Why Opt for This Calculator?
- Reliable Data: Utilize authentic Arkema S.A. financials for trustworthy valuation outcomes.
- Flexible: Tailor essential variables such as growth rates, WACC, and tax rates to fit your forecasts.
- Efficient: Built-in calculations save you the hassle of starting from square one.
- Expert-Level Tool: Crafted for investors, analysts, and consultants alike.
- Easy to Use: Clear layout and guided instructions ensure accessibility for all users.
Who Can Benefit from Arkema S.A. (AKEPA)?
- Investors: Make informed investment choices with advanced analytics tailored for the chemical sector.
- Financial Analysts: Enhance your analysis efficiency with ready-to-use financial models specific to Arkema S.A. (AKEPA).
- Consultants: Effortlessly tailor presentations or reports using our comprehensive templates focused on Arkema S.A. (AKEPA).
- Industry Enthusiasts: Expand your knowledge of the chemical industry and valuation methods through real-life scenarios.
- Educators and Students: Utilize Arkema S.A. (AKEPA) as a practical example in finance and business courses.
Contents of the Template
- Pre-Filled Data: Contains historical financial information and projections for Arkema S.A. (AKEPA).
- Discounted Cash Flow Model: An editable DCF model with automatic calculations for valuation.
- Weighted Average Cost of Capital (WACC): A dedicated worksheet for WACC calculations based on user-defined inputs.
- Key Financial Ratios: Evaluate Arkema’s profitability, operational efficiency, and financial leverage.
- Customizable Inputs: Easily adjust revenue growth, profit margins, and tax rates.
- Intuitive Dashboard: Visual summaries including charts and tables of essential valuation outcomes.
Disclaimer
All information, articles, and product details provided on this website are for general informational and educational purposes only. We do not claim any ownership over, nor do we intend to infringe upon, any trademarks, copyrights, logos, brand names, or other intellectual property mentioned or depicted on this site. Such intellectual property remains the property of its respective owners, and any references here are made solely for identification or informational purposes, without implying any affiliation, endorsement, or partnership.
We make no representations or warranties, express or implied, regarding the accuracy, completeness, or suitability of any content or products presented. Nothing on this website should be construed as legal, tax, investment, financial, medical, or other professional advice. In addition, no part of this site—including articles or product references—constitutes a solicitation, recommendation, endorsement, advertisement, or offer to buy or sell any securities, franchises, or other financial instruments, particularly in jurisdictions where such activity would be unlawful.
All content is of a general nature and may not address the specific circumstances of any individual or entity. It is not a substitute for professional advice or services. Any actions you take based on the information provided here are strictly at your own risk. You accept full responsibility for any decisions or outcomes arising from your use of this website and agree to release us from any liability in connection with your use of, or reliance upon, the content or products found herein.