
|
Valoración DCF de AMN Healthcare Services, Inc. (AMN) |
Completamente Editable: Adáptelo A Sus Necesidades En Excel O Sheets
Diseño Profesional: Plantillas Confiables Y Estándares De La Industria
Predeterminadas Para Un Uso Rápido Y Eficiente
Compatible con MAC / PC, completamente desbloqueado
No Se Necesita Experiencia; Fáciles De Seguir
AMN Healthcare Services, Inc. (AMN) Bundle
Diseñada para la precisión, nuestra calculadora DCF de AMN Healthcare Services, Inc. (AMN) le permite evaluar la valoración de AMN utilizando información financiera del mundo real, ofreciendo una flexibilidad completa para modificar todos los parámetros esenciales para mejorar las proyecciones.
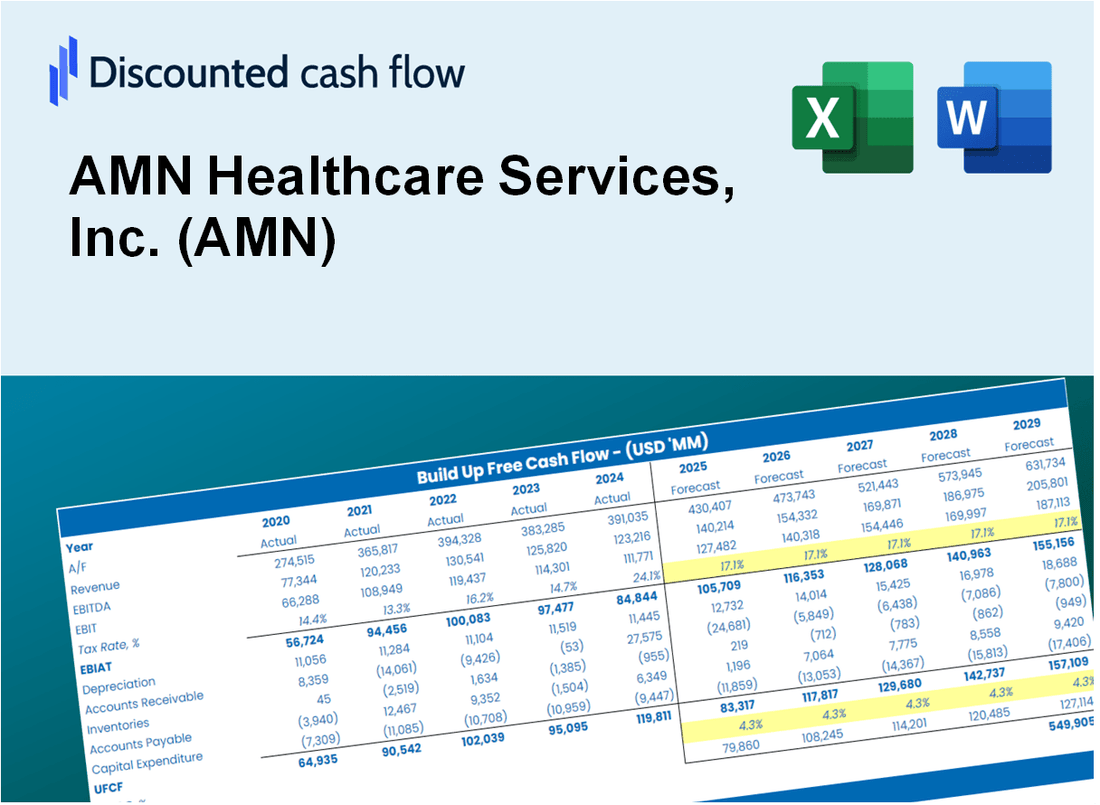
Discounted Cash Flow (DCF) - (USD MM)
| Year | AY1 2020 |
AY2 2021 |
AY3 2022 |
AY4 2023 |
AY5 2024 |
FY1 2025 |
FY2 2026 |
FY3 2027 |
FY4 2028 |
FY5 2029 |
|---|---|---|---|---|---|---|---|---|---|---|
| Revenue | 2,393.7 | 3,984.2 | 5,243.2 | 3,789.3 | 2,983.8 | 3,275.3 | 3,595.2 | 3,946.4 | 4,331.9 | 4,755.1 |
| Revenue Growth, % | 0 | 66.45 | 31.6 | -27.73 | -21.26 | 9.77 | 9.77 | 9.77 | 9.77 | 9.77 |
| EBITDA | 243.5 | 581.7 | 784.2 | 499.4 | 71.1 | 362.2 | 397.5 | 436.4 | 479.0 | 525.8 |
| EBITDA, % | 10.17 | 14.6 | 14.96 | 13.18 | 2.38 | 11.06 | 11.06 | 11.06 | 11.06 | 11.06 |
| Depreciation | 94.2 | 103.7 | 137.1 | 160.9 | 173.8 | 125.9 | 138.2 | 151.7 | 166.5 | 182.8 |
| Depreciation, % | 3.93 | 2.6 | 2.62 | 4.25 | 5.82 | 3.84 | 3.84 | 3.84 | 3.84 | 3.84 |
| EBIT | 149.3 | 478.0 | 647.1 | 338.4 | -102.7 | 236.2 | 259.3 | 284.7 | 312.5 | 343.0 |
| EBIT, % | 6.24 | 12 | 12.34 | 8.93 | -3.44 | 7.21 | 7.21 | 7.21 | 7.21 | 7.21 |
| Total Cash | 29.2 | 180.9 | 64.5 | 32.9 | 10.6 | 53.8 | 59.1 | 64.9 | 71.2 | 78.2 |
| Total Cash, percent | .0 | .0 | .0 | .0 | .0 | .0 | .0 | .0 | .0 | .0 |
| Account Receivables | 450.1 | 1,028.9 | 953.3 | 746.5 | 520.0 | 654.6 | 718.6 | 788.8 | 865.8 | 950.4 |
| Account Receivables, % | 18.8 | 25.82 | 18.18 | 19.7 | 17.43 | 19.99 | 19.99 | 19.99 | 19.99 | 19.99 |
| Inventories | 38.8 | 101.7 | .0 | .0 | .0 | 27.4 | 30.0 | 33.0 | 36.2 | 39.7 |
| Inventories, % | 1.62 | 2.55 | 0 | 0 | 0 | 0.83519 | 0.83519 | 0.83519 | 0.83519 | 0.83519 |
| Accounts Payable | 107.5 | 339.0 | 373.3 | 177.1 | 100.9 | 184.6 | 202.6 | 222.4 | 244.1 | 267.9 |
| Accounts Payable, % | 4.49 | 8.51 | 7.12 | 4.67 | 3.38 | 5.63 | 5.63 | 5.63 | 5.63 | 5.63 |
| Capital Expenditure | -39.1 | -53.7 | -80.9 | -105.4 | -80.9 | -65.6 | -72.0 | -79.1 | -86.8 | -95.3 |
| Capital Expenditure, % | -1.63 | -1.35 | -1.54 | -2.78 | -2.71 | -2 | -2 | -2 | -2 | -2 |
| Tax Rate, % | 14.83 | 14.83 | 14.83 | 14.83 | 14.83 | 14.83 | 14.83 | 14.83 | 14.83 | 14.83 |
| EBITAT | 115.2 | 352.5 | 473.6 | 250.8 | -87.4 | 181.2 | 198.9 | 218.3 | 239.6 | 263.0 |
| Depreciation | ||||||||||
| Changes in Account Receivables | ||||||||||
| Changes in Inventories | ||||||||||
| Changes in Accounts Payable | ||||||||||
| Capital Expenditure | ||||||||||
| UFCF | -211.1 | -7.5 | 741.4 | 316.8 | 155.8 | 163.1 | 216.5 | 237.6 | 260.8 | 286.3 |
| WACC, % | 4.76 | 4.63 | 4.61 | 4.64 | 5.06 | 4.74 | 4.74 | 4.74 | 4.74 | 4.74 |
| PV UFCF | ||||||||||
| SUM PV UFCF | 1,003.7 | |||||||||
| Long Term Growth Rate, % | 1.00 | |||||||||
| Free cash flow (T + 1) | 289 | |||||||||
| Terminal Value | 7,730 | |||||||||
| Present Terminal Value | 6,132 | |||||||||
| Enterprise Value | 7,135 | |||||||||
| Net Debt | 1,087 | |||||||||
| Equity Value | 6,048 | |||||||||
| Diluted Shares Outstanding, MM | 38 | |||||||||
| Equity Value Per Share | 158.38 |
What You Will Get
- Real AMN Financial Data: Pre-filled with AMN Healthcare Services' historical and projected data for precise analysis.
- Fully Editable Template: Modify key inputs like revenue growth, WACC, and EBITDA % with ease.
- Automatic Calculations: See AMN's intrinsic value update instantly based on your changes.
- Professional Valuation Tool: Designed for investors, analysts, and consultants seeking accurate DCF results.
- User-Friendly Design: Simple structure and clear instructions for all experience levels.
Key Features
- Comprehensive AMN Data: Pre-filled with AMN Healthcare’s historical performance metrics and future projections.
- Customizable Financial Inputs: Modify revenue growth rates, profit margins, discount rates, tax percentages, and capital investments.
- Interactive Valuation Model: Automatically refreshes Net Present Value (NPV) and intrinsic value based on your adjustments.
- Scenario Analysis: Develop various forecasting scenarios to evaluate different valuation possibilities.
- User-Centric Interface: Intuitive, organized, and tailored for both seasoned professionals and newcomers.
How It Works
- Step 1: Download the Excel file.
- Step 2: Review AMN Healthcare Services, Inc.'s pre-filled financial data and forecasts.
- Step 3: Modify critical inputs like revenue growth, WACC, and tax rates (highlighted cells).
- Step 4: Watch the DCF model update instantly as you tweak assumptions.
- Step 5: Analyze the outputs and use the results for investment decisions.
Why Choose AMN Healthcare Services, Inc. (AMN) Calculator?
- Accuracy: Utilizes real AMN financials for precise data representation.
- Flexibility: Tailored for users to easily test and adjust inputs as needed.
- Time-Saving: Avoid the complexities of creating a financial model from the ground up.
- Professional-Grade: Crafted with the precision and usability expected by CFOs.
- User-Friendly: Intuitive design makes it accessible for users without extensive financial modeling skills.
Who Should Use This Product?
- Healthcare Students: Understand healthcare staffing dynamics and apply concepts using real data.
- Researchers: Utilize industry-specific models in academic studies or healthcare analyses.
- Investors: Evaluate your own investment strategies and assess valuation outcomes for AMN Healthcare Services, Inc. (AMN).
- Market Analysts: Enhance your analysis with a tailored, user-friendly financial model for healthcare services.
- Healthcare Executives: Learn how large healthcare companies like AMN are evaluated and managed.
What the Template Contains
- Preloaded AMN Data: Historical and projected financial data, including revenue, EBIT, and capital expenditures.
- DCF and WACC Models: Professional-grade sheets for calculating intrinsic value and Weighted Average Cost of Capital.
- Editable Inputs: Yellow-highlighted cells for adjusting revenue growth, tax rates, and discount rates.
- Financial Statements: Comprehensive annual and quarterly financials for deeper analysis.
- Key Ratios: Profitability, leverage, and efficiency ratios to evaluate performance.
- Dashboard and Charts: Visual summaries of valuation outcomes and assumptions.
Disclaimer
All information, articles, and product details provided on this website are for general informational and educational purposes only. We do not claim any ownership over, nor do we intend to infringe upon, any trademarks, copyrights, logos, brand names, or other intellectual property mentioned or depicted on this site. Such intellectual property remains the property of its respective owners, and any references here are made solely for identification or informational purposes, without implying any affiliation, endorsement, or partnership.
We make no representations or warranties, express or implied, regarding the accuracy, completeness, or suitability of any content or products presented. Nothing on this website should be construed as legal, tax, investment, financial, medical, or other professional advice. In addition, no part of this site—including articles or product references—constitutes a solicitation, recommendation, endorsement, advertisement, or offer to buy or sell any securities, franchises, or other financial instruments, particularly in jurisdictions where such activity would be unlawful.
All content is of a general nature and may not address the specific circumstances of any individual or entity. It is not a substitute for professional advice or services. Any actions you take based on the information provided here are strictly at your own risk. You accept full responsibility for any decisions or outcomes arising from your use of this website and agree to release us from any liability in connection with your use of, or reliance upon, the content or products found herein.