
|
Anand Rathi Wealth Limited (Anandrathi.ns) Valoración de DCF |
Completamente Editable: Adáptelo A Sus Necesidades En Excel O Sheets
Diseño Profesional: Plantillas Confiables Y Estándares De La Industria
Predeterminadas Para Un Uso Rápido Y Eficiente
Compatible con MAC / PC, completamente desbloqueado
No Se Necesita Experiencia; Fáciles De Seguir
Anand Rathi Wealth Limited (ANANDRATHI.NS) Bundle
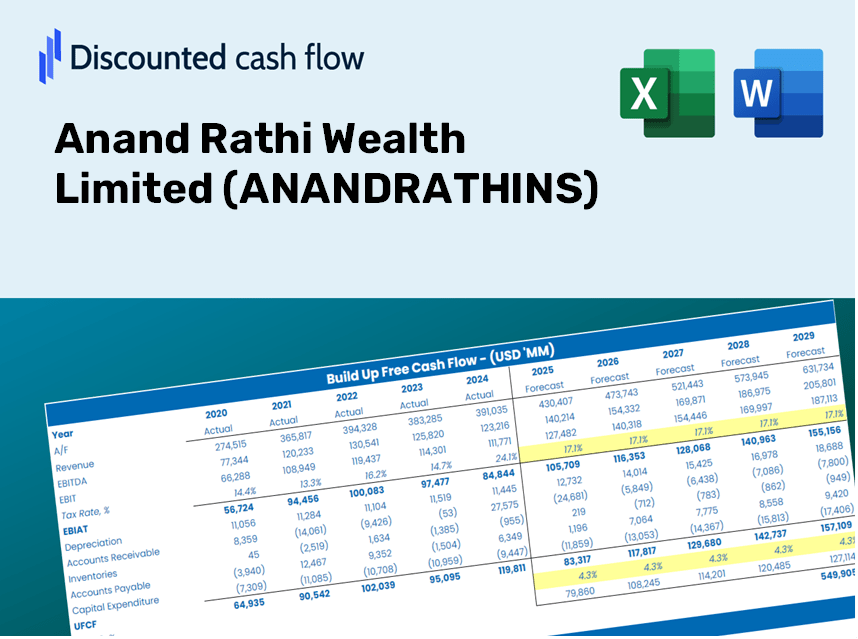
No importa si es un inversor o analista, esta calculadora DCF (anandrathins) es su recurso de referencia para una valoración precisa. Cargados con datos reales de Anand Rathi Wealth Limited, puede ajustar los pronósticos y observar los cambios en tiempo real.
Discounted Cash Flow (DCF) - (USD MM)
| Year | AY1 2021 |
AY2 2022 |
AY3 2023 |
AY4 2024 |
AY5 2025 |
FY1 2026 |
FY2 2027 |
FY3 2028 |
FY4 2029 |
FY5 2030 |
|---|---|---|---|---|---|---|---|---|---|---|
| Revenue | 2,653.3 | 4,229.7 | 5,589.1 | 7,519.7 | 9,806.5 | 13,643.4 | 18,981.6 | 26,408.4 | 36,741.1 | 51,116.5 |
| Revenue Growth, % | 0 | 59.41 | 32.14 | 34.54 | 30.41 | 39.13 | 39.13 | 39.13 | 39.13 | 39.13 |
| EBITDA | 835.0 | 1,850.2 | 2,489.3 | 3,320.8 | 4,247.5 | 5,654.6 | 7,867.0 | 10,945.1 | 15,227.5 | 21,185.5 |
| EBITDA, % | 31.47 | 43.74 | 44.54 | 44.16 | 43.31 | 41.45 | 41.45 | 41.45 | 41.45 | 41.45 |
| Depreciation | 177.3 | 156.5 | 166.1 | 193.6 | 79.9 | 456.9 | 635.6 | 884.3 | 1,230.3 | 1,711.7 |
| Depreciation, % | 6.68 | 3.7 | 2.97 | 2.57 | 0.81429 | 3.35 | 3.35 | 3.35 | 3.35 | 3.35 |
| EBIT | 657.7 | 1,693.7 | 2,323.2 | 3,127.2 | 4,167.7 | 5,197.7 | 7,231.4 | 10,060.8 | 13,997.2 | 19,473.8 |
| EBIT, % | 24.79 | 40.04 | 41.57 | 41.59 | 42.5 | 38.1 | 38.1 | 38.1 | 38.1 | 38.1 |
| Total Cash | 799.1 | 1,599.1 | 3,187.6 | 5,743.7 | 3,472.1 | 6,459.9 | 8,987.5 | 12,504.0 | 17,396.3 | 24,202.8 |
| Total Cash, percent | .0 | .0 | .0 | .0 | .0 | .0 | .0 | .0 | .0 | .0 |
| Account Receivables | 124.7 | 158.2 | 179.5 | 320.4 | 386.5 | 541.7 | 753.7 | 1,048.6 | 1,458.8 | 2,029.6 |
| Account Receivables, % | 4.7 | 3.74 | 3.21 | 4.26 | 3.94 | 3.97 | 3.97 | 3.97 | 3.97 | 3.97 |
| Inventories | .1 | -93.5 | -1,297.5 | .0 | .0 | -693.7 | -965.1 | -1,342.7 | -1,868.0 | -2,598.9 |
| Inventories, % | 0.00342969 | -2.21 | -23.21 | 0 | 0 | -5.08 | -5.08 | -5.08 | -5.08 | -5.08 |
| Accounts Payable | 2.0 | 157.9 | 3.1 | .2 | .7 | 105.8 | 147.1 | 204.7 | 284.8 | 396.3 |
| Accounts Payable, % | 0.07624468 | 3.73 | 0.05634191 | 0.00273948 | 0.0068322 | 0.77522 | 0.77522 | 0.77522 | 0.77522 | 0.77522 |
| Capital Expenditure | -13.0 | -154.5 | -169.3 | -45.0 | -357.7 | -311.5 | -433.4 | -602.9 | -838.8 | -1,167.0 |
| Capital Expenditure, % | -0.48845 | -3.65 | -3.03 | -0.59876 | -3.65 | -2.28 | -2.28 | -2.28 | -2.28 | -2.28 |
| Tax Rate, % | 25.93 | 25.93 | 25.93 | 25.93 | 25.93 | 25.93 | 25.93 | 25.93 | 25.93 | 25.93 |
| EBITAT | 466.6 | 1,280.1 | 1,716.8 | 2,302.1 | 3,086.8 | 3,826.6 | 5,323.8 | 7,406.9 | 10,304.9 | 14,336.8 |
| Depreciation | ||||||||||
| Changes in Account Receivables | ||||||||||
| Changes in Inventories | ||||||||||
| Changes in Accounts Payable | ||||||||||
| Capital Expenditure | ||||||||||
| UFCF | 508.2 | 1,498.1 | 2,741.6 | 1,009.3 | 2,743.3 | 4,615.6 | 5,626.9 | 7,828.5 | 10,891.6 | 15,153.0 |
| WACC, % | 5.56 | 5.56 | 5.56 | 5.56 | 5.56 | 5.56 | 5.56 | 5.56 | 5.56 | 5.56 |
| PV UFCF | ||||||||||
| SUM PV UFCF | 36,411.1 | |||||||||
| Long Term Growth Rate, % | 2.00 | |||||||||
| Free cash flow (T + 1) | 15,456 | |||||||||
| Terminal Value | 434,183 | |||||||||
| Present Terminal Value | 331,268 | |||||||||
| Enterprise Value | 367,680 | |||||||||
| Net Debt | 352 | |||||||||
| Equity Value | 367,327 | |||||||||
| Diluted Shares Outstanding, MM | 83 | |||||||||
| Equity Value Per Share | 4,416.64 |
What You Will Receive
- Authentic Anand Rathi Data: Preloaded financial information – from revenue to EBIT – based on actual and projected metrics.
- Complete Customization: Modify all essential parameters (yellow cells) such as WACC, growth %, and tax rates.
- Immediate Valuation Updates: Automatic recalculations to assess the effects of changes on Anand Rathi Wealth Limited’s fair value.
- Flexible Excel Template: Designed for quick modifications, scenario analysis, and comprehensive projections.
- Efficient and Precise: Avoid the hassle of building models from scratch while ensuring accuracy and adaptability.
Key Features
- Real-Time ANANDRATHINS Data: Pre-loaded with Anand Rathi Wealth Limited’s historical financial performance and future projections.
- Fully Customizable Inputs: Modify revenue growth rates, profit margins, WACC, tax rates, and capital expenditures as needed.
- Dynamic Valuation Model: Automatic recalculations of Net Present Value (NPV) and intrinsic value based on your adjustments.
- Scenario Analysis: Develop various forecasting scenarios to explore different valuation possibilities.
- User-Friendly Interface: Intuitive, organized layout catering to both professionals and beginners.
How It Works
- Step 1: Download the prebuilt Excel template featuring data for Anand Rathi Wealth Limited (ANANDRATHINS).
- Step 2: Review the pre-filled sheets to familiarize yourself with the essential metrics.
- Step 3: Modify forecasts and assumptions in the editable yellow cells (WACC, growth, margins).
- Step 4: Instantly see the recalculated results, including the intrinsic value of Anand Rathi Wealth Limited (ANANDRATHINS).
- Step 5: Use the outputs to make informed investment decisions or generate comprehensive reports.
Why Opt for This Calculator?
- Designed for Industry Experts: A sophisticated tool tailored for analysts, CFOs, and financial consultants.
- Accurate Financial Data: Historical and projected financial figures for Anand Rathi Wealth Limited (ANANDRATHINS) preloaded for precision.
- Flexible Scenario Analysis: Effortlessly simulate various forecasts and assumptions.
- Comprehensive Outputs: Instantly calculates intrinsic value, NPV, and essential financial metrics.
- User-Friendly Interface: Step-by-step guidance helps you navigate the process with ease.
Who Can Benefit from This Product?
- Investors: Assess the valuation of Anand Rathi Wealth Limited (ANANDRATHINS) prior to making investment decisions.
- CFOs and Financial Analysts: Enhance valuation workflows and validate financial forecasts.
- Startup Founders: Gain insights into how established firms like Anand Rathi are valued in the market.
- Consultants: Provide comprehensive valuation reports for clients in need.
- Students and Educators: Utilize authentic data to explore and instruct valuation methodologies.
What the Template Contains
- Historical Data: Includes Anand Rathi Wealth Limited's past financials and baseline forecasts.
- DCF and Levered DCF Models: Detailed templates to calculate Anand Rathi Wealth Limited's intrinsic value.
- WACC Sheet: Pre-built calculations for Weighted Average Cost of Capital.
- Editable Inputs: Modify key drivers such as growth rates, EBITDA %, and CAPEX assumptions.
- Quarterly and Annual Statements: A comprehensive breakdown of Anand Rathi Wealth Limited's financials.
- Interactive Dashboard: Dynamically visualize valuation results and projections.
Disclaimer
All information, articles, and product details provided on this website are for general informational and educational purposes only. We do not claim any ownership over, nor do we intend to infringe upon, any trademarks, copyrights, logos, brand names, or other intellectual property mentioned or depicted on this site. Such intellectual property remains the property of its respective owners, and any references here are made solely for identification or informational purposes, without implying any affiliation, endorsement, or partnership.
We make no representations or warranties, express or implied, regarding the accuracy, completeness, or suitability of any content or products presented. Nothing on this website should be construed as legal, tax, investment, financial, medical, or other professional advice. In addition, no part of this site—including articles or product references—constitutes a solicitation, recommendation, endorsement, advertisement, or offer to buy or sell any securities, franchises, or other financial instruments, particularly in jurisdictions where such activity would be unlawful.
All content is of a general nature and may not address the specific circumstances of any individual or entity. It is not a substitute for professional advice or services. Any actions you take based on the information provided here are strictly at your own risk. You accept full responsibility for any decisions or outcomes arising from your use of this website and agree to release us from any liability in connection with your use of, or reliance upon, the content or products found herein.