
|
Anant Raj Limited (Anantraj.ns) Valoración de DCF |
Completamente Editable: Adáptelo A Sus Necesidades En Excel O Sheets
Diseño Profesional: Plantillas Confiables Y Estándares De La Industria
Predeterminadas Para Un Uso Rápido Y Eficiente
Compatible con MAC / PC, completamente desbloqueado
No Se Necesita Experiencia; Fáciles De Seguir
Anant Raj Limited (ANANTRAJ.NS) Bundle
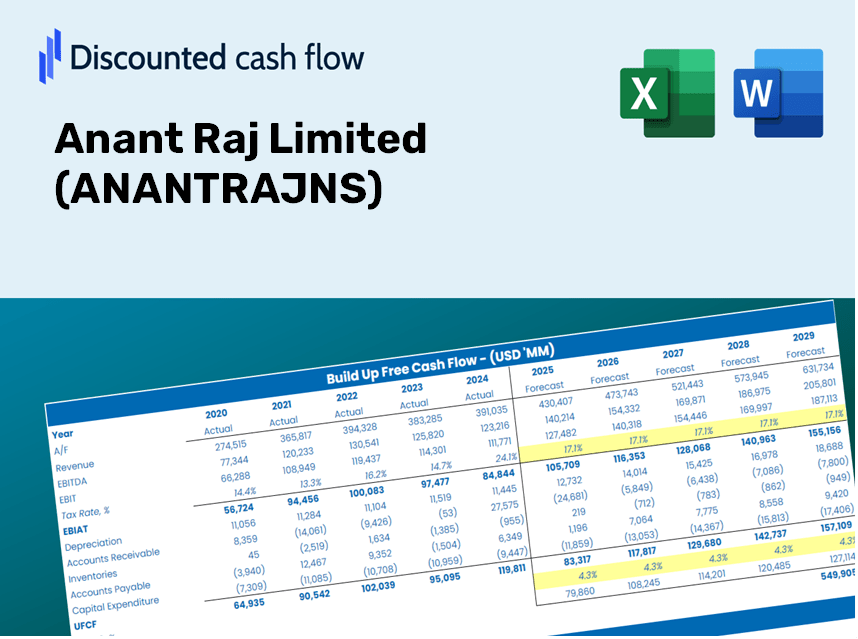
¡Optimice su tiempo y mejore la precisión con nuestra calculadora DCF (anantrajns)! Cargados con datos reales de suposiciones limitadas y personalizables de Anant Raj, esta herramienta le permite pronosticar, analizar y evaluar Anant Raj Limited como un inversor experimentado.
What You Will Receive
- Comprehensive ANANTRAJNS Financials: Access to both historical and projected data for precise valuation.
- Customizable Inputs: Adjust WACC, tax rates, revenue growth, and capital expenditures as needed.
- Dynamic Calculations: Intrinsic value and NPV are automatically computed.
- Scenario Simulation: Explore various scenarios to assess Anant Raj Limited's future performance.
- User-Friendly Interface: Designed for professionals while remaining approachable for newcomers.
Key Features
- Real-Life ANANTRAJNS Data: Pre-populated with Anant Raj Limited's historical financials and future projections.
- Completely Customizable Inputs: Modify revenue growth, profit margins, weighted average cost of capital (WACC), tax rates, and capital expenditures.
- Dynamic Valuation Model: Automatic recalculations of Net Present Value (NPV) and intrinsic value based on your specified inputs.
- Scenario Analysis: Develop various forecast scenarios to evaluate different valuation possibilities.
- User-Friendly Interface: Intuitive design tailored for both professionals and novices.
How It Functions
- Download the Template: Gain immediate access to the Excel-based Anant Raj Limited DCF Calculator.
- Input Your Assumptions: Modify the yellow-highlighted cells for growth rates, WACC, margins, and various other parameters.
- Instant Calculations: The model automatically recalculates the intrinsic value of Anant Raj Limited.
- Test Scenarios: Experiment with different assumptions to assess potential changes in valuation.
- Analyze and Decide: Utilize the findings to inform your investment strategy or financial analysis.
Why Choose This Calculator for Anant Raj Limited (ANANTRAJNS)?
- Precise Data: Utilize actual financial figures from Anant Raj Limited for trustworthy valuation insights.
- Adjustable Parameters: Modify essential inputs such as growth rates, WACC, and tax rates to fit your forecasts.
- Efficient: Built-in calculations save you time by providing a head start on your analysis.
- Professional-Quality Tool: Tailored for investors, analysts, and consultants in the real estate sector.
- Easy to Use: A streamlined design and comprehensive guide help users navigate effortlessly.
Who Can Benefit from Anant Raj Limited (ANANTRAJNS)?
- Investors: Gain assurance in your investment choices with our expert valuation tools.
- Financial Analysts: Streamline your workflow with our customizable DCF model, designed for efficiency.
- Consultants: Easily tailor our templates for client presentations and detailed reports.
- Finance Enthusiasts: Enhance your knowledge of valuation methods through real-world applications.
- Educators and Students: Utilize our resources as a hands-on learning aid in finance courses.
Contents of the Template
- Pre-Populated Information: Features Anant Raj Limited's historical financial data and projections.
- Discounted Cash Flow Model: Customizable DCF valuation model with automated calculations.
- Weighted Average Cost of Capital (WACC): A specific section for calculating WACC using tailored inputs.
- Essential Financial Ratios: Assess Anant Raj Limited’s profitability, efficiency, and leverage metrics.
- Editable Inputs: Easily modify revenue growth, profit margins, and tax rates.
- User-Friendly Dashboard: Visual representations and tables summarizing key valuation findings.
Disclaimer
All information, articles, and product details provided on this website are for general informational and educational purposes only. We do not claim any ownership over, nor do we intend to infringe upon, any trademarks, copyrights, logos, brand names, or other intellectual property mentioned or depicted on this site. Such intellectual property remains the property of its respective owners, and any references here are made solely for identification or informational purposes, without implying any affiliation, endorsement, or partnership.
We make no representations or warranties, express or implied, regarding the accuracy, completeness, or suitability of any content or products presented. Nothing on this website should be construed as legal, tax, investment, financial, medical, or other professional advice. In addition, no part of this site—including articles or product references—constitutes a solicitation, recommendation, endorsement, advertisement, or offer to buy or sell any securities, franchises, or other financial instruments, particularly in jurisdictions where such activity would be unlawful.
All content is of a general nature and may not address the specific circumstances of any individual or entity. It is not a substitute for professional advice or services. Any actions you take based on the information provided here are strictly at your own risk. You accept full responsibility for any decisions or outcomes arising from your use of this website and agree to release us from any liability in connection with your use of, or reliance upon, the content or products found herein.