
|
Valoración DCF de AppTech Payments Corp. (APCX) |
Completamente Editable: Adáptelo A Sus Necesidades En Excel O Sheets
Diseño Profesional: Plantillas Confiables Y Estándares De La Industria
Predeterminadas Para Un Uso Rápido Y Eficiente
Compatible con MAC / PC, completamente desbloqueado
No Se Necesita Experiencia; Fáciles De Seguir
AppTech Payments Corp. (APCX) Bundle
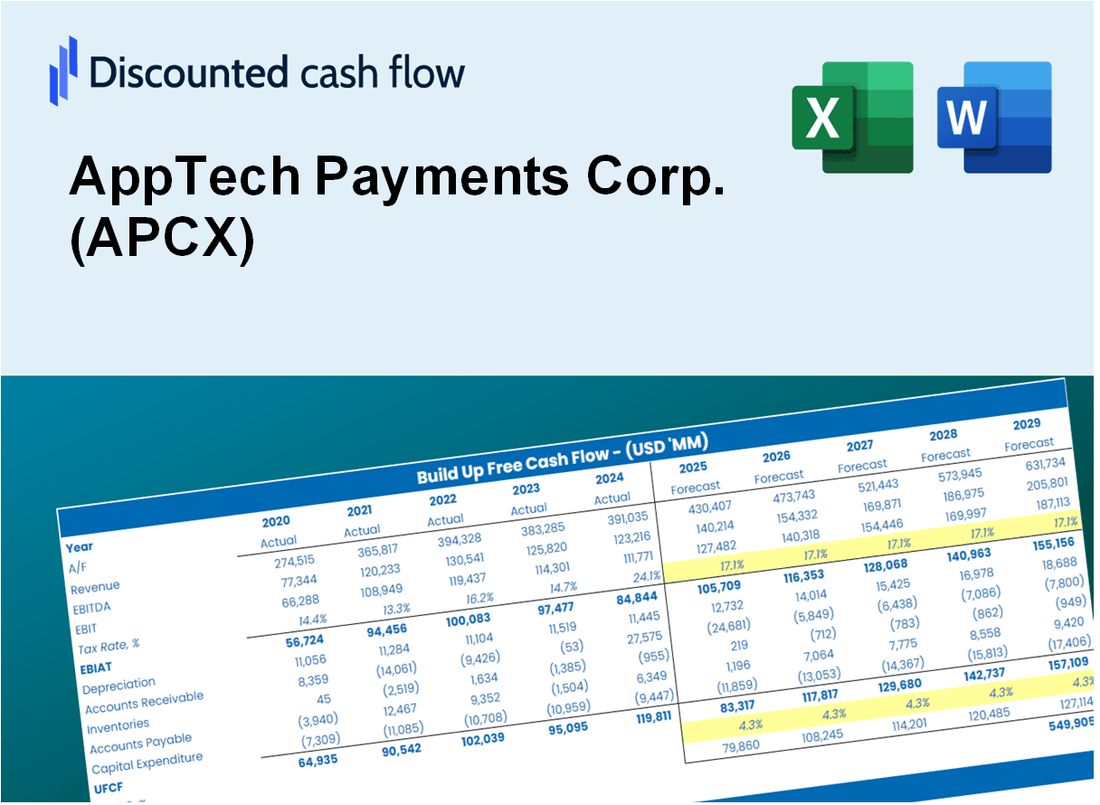
¡Evalúe la perspectiva financiera de AppTech Payments Corp. (APCX) como un experto! Esta calculadora DCF (APCX) proporciona datos financieros preconsados y ofrece una flexibilidad total para modificar el crecimiento de los ingresos, WACC, los márgenes y otros supuestos cruciales para alinearse con sus proyecciones.
What You Will Get
- Real APCX Financial Data: Pre-filled with AppTech Payments Corp.'s historical and projected data for accurate analysis.
- Fully Editable Template: Easily modify key inputs such as revenue growth, WACC, and EBITDA %.
- Automatic Calculations: Watch AppTech’s intrinsic value update in real-time based on your adjustments.
- Professional Valuation Tool: Tailored for investors, analysts, and consultants aiming for precise DCF outcomes.
- User-Friendly Design: Intuitive layout and straightforward instructions suitable for all experience levels.
Key Features
- Comprehensive Financial Data: AppTech Payments Corp.'s (APCX) historical financial statements and pre-filled forecasts.
- Customizable Inputs: Modify WACC, tax rates, revenue growth, and EBITDA margins as needed.
- Real-Time Calculations: View AppTech Payments Corp.'s (APCX) intrinsic value update instantly.
- Intuitive Visual Outputs: Dashboard charts showcase valuation results and essential metrics.
- Designed for Precision: A professional-grade tool for analysts, investors, and finance professionals.
How It Works
- Download: Get the comprehensive Excel file featuring AppTech Payments Corp.'s (APCX) financial data.
- Customize: Tailor forecasts, including revenue growth, EBITDA %, and WACC to your needs.
- Update Automatically: Watch as intrinsic value and NPV calculations refresh in real-time.
- Test Scenarios: Develop various projections and instantly compare the results.
- Make Decisions: Leverage the valuation insights to inform your investment strategy.
Why Choose This Calculator for AppTech Payments Corp. (APCX)?
- Accurate Data: Real AppTech Payments financials ensure reliable valuation results.
- Customizable: Adjust key parameters like growth rates, WACC, and tax rates to align with your projections.
- Time-Saving: Pre-built calculations save you from starting from scratch.
- Professional-Grade Tool: Tailored for investors, analysts, and consultants in the payments sector.
- User-Friendly: Intuitive design and step-by-step guidance make it accessible for all users.
Who Should Use AppTech Payments Corp. (APCX)?
- Investors: Make informed decisions with a robust platform for payment solutions.
- Financial Analysts: Streamline your analysis with comprehensive data and insights tailored for the payments industry.
- Consultants: Effortlessly customize solutions for client projects and presentations in the fintech sector.
- Finance Enthusiasts: Enhance your knowledge of payment technologies and trends through real-life applications.
- Educators and Students: Utilize it as a valuable resource for learning about payment systems and financial technology in academic settings.
What the Template Contains
- Preloaded APCX Data: Historical and projected financial data, including revenue, EBIT, and capital expenditures.
- DCF and WACC Models: Professional-grade sheets for calculating intrinsic value and Weighted Average Cost of Capital.
- Editable Inputs: Yellow-highlighted cells for adjusting revenue growth, tax rates, and discount rates.
- Financial Statements: Comprehensive annual and quarterly financials for deeper analysis.
- Key Ratios: Profitability, leverage, and efficiency ratios to evaluate performance.
- Dashboard and Charts: Visual summaries of valuation outcomes and assumptions.
Disclaimer
All information, articles, and product details provided on this website are for general informational and educational purposes only. We do not claim any ownership over, nor do we intend to infringe upon, any trademarks, copyrights, logos, brand names, or other intellectual property mentioned or depicted on this site. Such intellectual property remains the property of its respective owners, and any references here are made solely for identification or informational purposes, without implying any affiliation, endorsement, or partnership.
We make no representations or warranties, express or implied, regarding the accuracy, completeness, or suitability of any content or products presented. Nothing on this website should be construed as legal, tax, investment, financial, medical, or other professional advice. In addition, no part of this site—including articles or product references—constitutes a solicitation, recommendation, endorsement, advertisement, or offer to buy or sell any securities, franchises, or other financial instruments, particularly in jurisdictions where such activity would be unlawful.
All content is of a general nature and may not address the specific circumstances of any individual or entity. It is not a substitute for professional advice or services. Any actions you take based on the information provided here are strictly at your own risk. You accept full responsibility for any decisions or outcomes arising from your use of this website and agree to release us from any liability in connection with your use of, or reliance upon, the content or products found herein.