
|
Valoración DCF de Amphenol Corporation (APH) |
Completamente Editable: Adáptelo A Sus Necesidades En Excel O Sheets
Diseño Profesional: Plantillas Confiables Y Estándares De La Industria
Predeterminadas Para Un Uso Rápido Y Eficiente
Compatible con MAC / PC, completamente desbloqueado
No Se Necesita Experiencia; Fáciles De Seguir
Amphenol Corporation (APH) Bundle
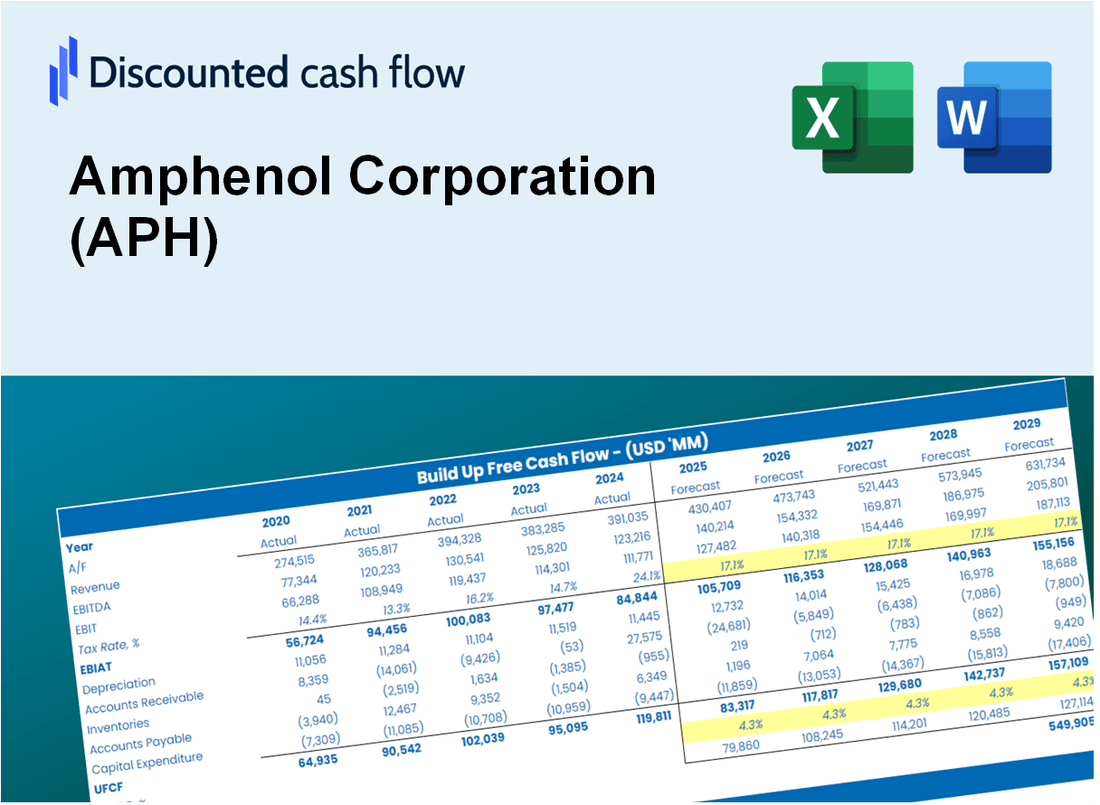
¡Evalúe el futuro financiero de Amphenol Corporation como un experto! Esta calculadora DCF (APH) le proporciona datos financieros previamente llenos y la flexibilidad para modificar el crecimiento de los ingresos, WACC, los márgenes y otros supuestos cruciales para alinearse con sus proyecciones.
What You Will Receive
- Comprehensive Financial Model: Leverage Amphenol Corporation’s (APH) actual data for accurate DCF valuation.
- Full Control Over Forecasting: Modify revenue growth, profit margins, WACC, and other essential parameters.
- Real-Time Calculations: Automatic updates provide immediate results as you make adjustments.
- Professional-Grade Template: A polished Excel file crafted for high-quality valuation presentations.
- Flexible and Reusable: Designed for adaptability, allowing for repeated use in detailed forecasting efforts.
Key Features
- Accurate Amphenol Financials: Gain access to reliable pre-loaded historical data and future forecasts.
- Adjustable Forecast Parameters: Modify highlighted cells, including WACC, growth rates, and profit margins.
- Real-Time Calculations: Automatic updates for DCF, Net Present Value (NPV), and cash flow assessments.
- Interactive Dashboard: User-friendly charts and summaries to help visualize your valuation findings.
- Designed for All Levels: A straightforward, intuitive layout tailored for investors, CFOs, and consultants.
How It Works
- Step 1: Download the Excel file.
- Step 2: Review pre-entered Amphenol Corporation (APH) data (historical and projected).
- Step 3: Adjust key assumptions (yellow cells) based on your analysis.
- Step 4: View automatic recalculations for Amphenol Corporation’s intrinsic value.
- Step 5: Use the outputs for investment decisions or reporting.
Why Choose This Calculator for Amphenol Corporation (APH)?
- Accurate Data: Utilize real Amphenol financials for dependable valuation outcomes.
- Customizable: Tailor essential parameters such as growth rates, WACC, and tax rates to fit your forecasts.
- Time-Saving: Pre-configured calculations save you the hassle of starting anew.
- Professional-Grade Tool: Crafted for investors, analysts, and consultants in the industry.
- User-Friendly: An intuitive design with clear instructions makes it accessible for everyone.
Who Should Use This Product?
- Investors: Accurately assess Amphenol Corporation’s (APH) fair value prior to making investment choices.
- CFOs: Utilize a top-tier DCF model for financial reporting and analysis related to Amphenol Corporation (APH).
- Consultants: Efficiently customize the template for valuation reports focused on Amphenol Corporation (APH) for clients.
- Entrepreneurs: Acquire knowledge on financial modeling practices employed by leading companies like Amphenol Corporation (APH).
- Educators: Implement it as an instructional resource to illustrate valuation techniques using Amphenol Corporation (APH) as a case study.
What the Template Contains
- Preloaded APH Data: Historical and projected financial data, including revenue, EBIT, and capital expenditures.
- DCF and WACC Models: Professional-grade sheets for calculating intrinsic value and Weighted Average Cost of Capital.
- Editable Inputs: Yellow-highlighted cells for adjusting revenue growth, tax rates, and discount rates.
- Financial Statements: Comprehensive annual and quarterly financials for deeper analysis.
- Key Ratios: Profitability, leverage, and efficiency ratios to evaluate performance.
- Dashboard and Charts: Visual summaries of valuation outcomes and assumptions.
Disclaimer
All information, articles, and product details provided on this website are for general informational and educational purposes only. We do not claim any ownership over, nor do we intend to infringe upon, any trademarks, copyrights, logos, brand names, or other intellectual property mentioned or depicted on this site. Such intellectual property remains the property of its respective owners, and any references here are made solely for identification or informational purposes, without implying any affiliation, endorsement, or partnership.
We make no representations or warranties, express or implied, regarding the accuracy, completeness, or suitability of any content or products presented. Nothing on this website should be construed as legal, tax, investment, financial, medical, or other professional advice. In addition, no part of this site—including articles or product references—constitutes a solicitation, recommendation, endorsement, advertisement, or offer to buy or sell any securities, franchises, or other financial instruments, particularly in jurisdictions where such activity would be unlawful.
All content is of a general nature and may not address the specific circumstances of any individual or entity. It is not a substitute for professional advice or services. Any actions you take based on the information provided here are strictly at your own risk. You accept full responsibility for any decisions or outcomes arising from your use of this website and agree to release us from any liability in connection with your use of, or reliance upon, the content or products found herein.