
|
Apollo Tires Limited (ApolloTyre.NS) DCF Valoración |
Completamente Editable: Adáptelo A Sus Necesidades En Excel O Sheets
Diseño Profesional: Plantillas Confiables Y Estándares De La Industria
Predeterminadas Para Un Uso Rápido Y Eficiente
Compatible con MAC / PC, completamente desbloqueado
No Se Necesita Experiencia; Fáciles De Seguir
Apollo Tyres Limited (APOLLOTYRE.NS) Bundle
¡Mejore sus estrategias de inversión con la calculadora DCF de Apollo Tires Limited (Apollotyrens)! Explore los datos financieros reales para los neumáticos Apollo, ajuste las predicciones y gastos de crecimiento, y observe instantáneamente cómo estos ajustes afectan el valor intrínseco de los apoloLotyrens.
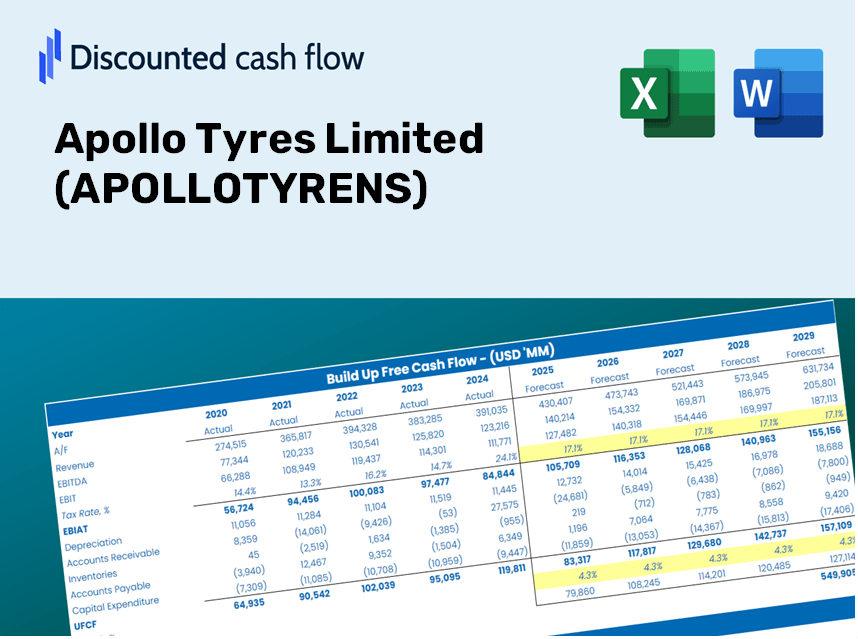
Discounted Cash Flow (DCF) - (USD MM)
| Year | AY1 2021 |
AY2 2022 |
AY3 2023 |
AY4 2024 |
AY5 2025 |
FY1 2026 |
FY2 2027 |
FY3 2028 |
FY4 2029 |
FY5 2030 |
|---|---|---|---|---|---|---|---|---|---|---|
| Revenue | 169,546.1 | 205,808.1 | 241,223.2 | 250,203.6 | 261,234.2 | 291,750.9 | 325,832.6 | 363,895.5 | 406,404.9 | 453,880.2 |
| Revenue Growth, % | 0 | 21.39 | 17.21 | 3.72 | 4.41 | 11.68 | 11.68 | 11.68 | 11.68 | 11.68 |
| EBITDA | 23,139.4 | 26,742.1 | 33,707.1 | 45,434.0 | 34,916.3 | 42,093.6 | 47,010.9 | 52,502.6 | 58,635.9 | 65,485.6 |
| EBITDA, % | 13.65 | 12.99 | 13.97 | 18.16 | 13.37 | 14.43 | 14.43 | 14.43 | 14.43 | 14.43 |
| Depreciation | 13,149.5 | 13,996.7 | 14,191.4 | 14,778.3 | 14,983.7 | 18,719.9 | 20,906.7 | 23,349.0 | 26,076.5 | 29,122.7 |
| Depreciation, % | 7.76 | 6.8 | 5.88 | 5.91 | 5.74 | 6.42 | 6.42 | 6.42 | 6.42 | 6.42 |
| EBIT | 9,989.9 | 12,745.4 | 19,515.6 | 30,655.7 | 19,932.6 | 23,373.8 | 26,104.2 | 29,153.7 | 32,559.3 | 36,362.8 |
| EBIT, % | 5.89 | 6.19 | 8.09 | 12.25 | 7.63 | 8.01 | 8.01 | 8.01 | 8.01 | 8.01 |
| Total Cash | 22,344.3 | 15,402.3 | 12,391.1 | 14,053.2 | 11,066.3 | 20,803.2 | 23,233.3 | 25,947.4 | 28,978.5 | 32,363.7 |
| Total Cash, percent | .0 | .0 | .0 | .0 | .0 | .0 | .0 | .0 | .0 | .0 |
| Account Receivables | 13,808.2 | 20,512.9 | 24,885.3 | 26,648.4 | 30,621.0 | 29,641.8 | 33,104.5 | 36,971.7 | 41,290.7 | 46,114.1 |
| Account Receivables, % | 8.14 | 9.97 | 10.32 | 10.65 | 11.72 | 10.16 | 10.16 | 10.16 | 10.16 | 10.16 |
| Inventories | 33,185.3 | 41,553.9 | 44,284.6 | 42,457.3 | 51,311.6 | 55,276.9 | 61,734.2 | 68,945.9 | 77,000.0 | 85,994.9 |
| Inventories, % | 19.57 | 20.19 | 18.36 | 16.97 | 19.64 | 18.95 | 18.95 | 18.95 | 18.95 | 18.95 |
| Accounts Payable | 25,423.0 | 35,309.5 | 33,956.0 | 29,786.5 | 28,744.4 | 40,341.0 | 45,053.5 | 50,316.6 | 56,194.4 | 62,758.9 |
| Accounts Payable, % | 14.99 | 17.16 | 14.08 | 11.9 | 11 | 13.83 | 13.83 | 13.83 | 13.83 | 13.83 |
| Capital Expenditure | -11,902.2 | -18,462.4 | -7,768.5 | -7,304.2 | -7,686.1 | -14,630.0 | -16,339.0 | -18,247.7 | -20,379.4 | -22,760.0 |
| Capital Expenditure, % | -7.02 | -8.97 | -3.22 | -2.92 | -2.94 | -5.01 | -5.01 | -5.01 | -5.01 | -5.01 |
| Tax Rate, % | 27.5 | 27.5 | 27.5 | 27.5 | 27.5 | 27.5 | 27.5 | 27.5 | 27.5 | 27.5 |
| EBITAT | 6,234.0 | 9,601.8 | 14,301.1 | 20,779.8 | 14,451.2 | 16,422.6 | 18,341.0 | 20,483.5 | 22,876.4 | 25,548.7 |
| Depreciation | ||||||||||
| Changes in Account Receivables | ||||||||||
| Changes in Inventories | ||||||||||
| Changes in Accounts Payable | ||||||||||
| Capital Expenditure | ||||||||||
| UFCF | -14,089.3 | -50.6 | 12,267.3 | 24,148.7 | 7,879.9 | 29,122.8 | 17,701.2 | 19,769.0 | 22,078.4 | 24,657.5 |
| WACC, % | 5.01 | 5.17 | 5.14 | 5.08 | 5.13 | 5.11 | 5.11 | 5.11 | 5.11 | 5.11 |
| PV UFCF | ||||||||||
| SUM PV UFCF | 98,069.1 | |||||||||
| Long Term Growth Rate, % | 3.50 | |||||||||
| Free cash flow (T + 1) | 25,521 | |||||||||
| Terminal Value | 1,588,687 | |||||||||
| Present Terminal Value | 1,238,491 | |||||||||
| Enterprise Value | 1,336,560 | |||||||||
| Net Debt | 35,243 | |||||||||
| Equity Value | 1,301,317 | |||||||||
| Diluted Shares Outstanding, MM | 635 | |||||||||
| Equity Value Per Share | 2,048.95 |
What You Will Receive
- Authentic APOLLOTYRENS Financial Data: Pre-filled with Apollo Tyres’ historical and projected figures for accurate analysis.
- Completely Customizable Template: Easily adjust key inputs such as revenue growth, WACC, and EBITDA %.
- Instant Calculations: Watch Apollo Tyres’ intrinsic value update in real-time as you modify your inputs.
- Professional Valuation Tool: Tailored for investors, analysts, and consultants aiming for precise DCF results.
- Intuitive Design: A straightforward layout and clear guidance suitable for all skill levels.
Key Features
- Comprehensive Financial Data: Access Apollo Tyres Limited's historical financial statements and pre-filled forecasts.
- Customizable Parameters: Adjust WACC, tax rates, revenue growth, and EBITDA margins to fit your analysis.
- Real-Time Calculations: Observe the intrinsic value of Apollo Tyres Limited recalculating instantly.
- Intuitive Visual Outputs: Dashboard charts present valuation outcomes and essential metrics clearly.
- Designed for Precision: A robust tool tailored for analysts, investors, and financial professionals.
How It Operates
- 1. Access the Template: Download and open the Excel file containing Apollo Tyres Limited’s preloaded data.
- 2. Modify Assumptions: Adjust critical variables such as growth rates, WACC, and capital expenditures.
- 3. Instant Results: The DCF model automatically computes intrinsic value and NPV in real-time.
- 4. Explore Scenarios: Evaluate various forecasts to understand different valuation possibilities.
- 5. Present with Assurance: Deliver professional valuation insights to enhance your decision-making process.
Why Choose This Calculator?
- Accurate Data: Access real Apollo Tyres Limited (APOLLOTYRENS) financials for trustworthy valuation outcomes.
- Customizable: Tailor key metrics such as growth rates, WACC, and tax rates to fit your forecasts.
- Time-Saving: Built-in calculations streamline the process and save you time.
- Professional-Grade Tool: Ideal for investors, analysts, and consultants in the tyre industry.
- User-Friendly: Featuring an intuitive interface and clear instructions for easy navigation.
Who Can Benefit from This Product?
- Professional Investors: Develop comprehensive and accurate valuation models for portfolio evaluation focused on Apollo Tyres Limited (APOLLOTYRENS).
- Corporate Finance Teams: Assess valuation scenarios to inform strategic decision-making within the organization.
- Consultants and Advisors: Deliver precise valuation insights and recommendations for clients invested in Apollo Tyres Limited (APOLLOTYRENS).
- Students and Educators: Utilize real-world market data to enhance learning and practice in financial modeling.
- Automotive Industry Enthusiasts: Gain insights into how companies like Apollo Tyres Limited (APOLLOTYRENS) are valued in the competitive market landscape.
What the Template Contains
- Historical Data: A comprehensive overview of Apollo Tyres Limited's past financial performance and baseline forecasts.
- DCF and Levered DCF Models: Detailed templates for calculating the intrinsic value of Apollo Tyres Limited (APOLLOTYRENS).
- WACC Sheet: Pre-built calculations for the Weighted Average Cost of Capital for Apollo Tyres Limited.
- Editable Inputs: Customize key factors such as growth rates, EBITDA percentages, and CAPEX assumptions.
- Quarterly and Annual Statements: An exhaustive breakdown of Apollo Tyres Limited’s financial results.
- Interactive Dashboard: Dynamically visualize valuation results and future projections.
Disclaimer
All information, articles, and product details provided on this website are for general informational and educational purposes only. We do not claim any ownership over, nor do we intend to infringe upon, any trademarks, copyrights, logos, brand names, or other intellectual property mentioned or depicted on this site. Such intellectual property remains the property of its respective owners, and any references here are made solely for identification or informational purposes, without implying any affiliation, endorsement, or partnership.
We make no representations or warranties, express or implied, regarding the accuracy, completeness, or suitability of any content or products presented. Nothing on this website should be construed as legal, tax, investment, financial, medical, or other professional advice. In addition, no part of this site—including articles or product references—constitutes a solicitation, recommendation, endorsement, advertisement, or offer to buy or sell any securities, franchises, or other financial instruments, particularly in jurisdictions where such activity would be unlawful.
All content is of a general nature and may not address the specific circumstances of any individual or entity. It is not a substitute for professional advice or services. Any actions you take based on the information provided here are strictly at your own risk. You accept full responsibility for any decisions or outcomes arising from your use of this website and agree to release us from any liability in connection with your use of, or reliance upon, the content or products found herein.