
|
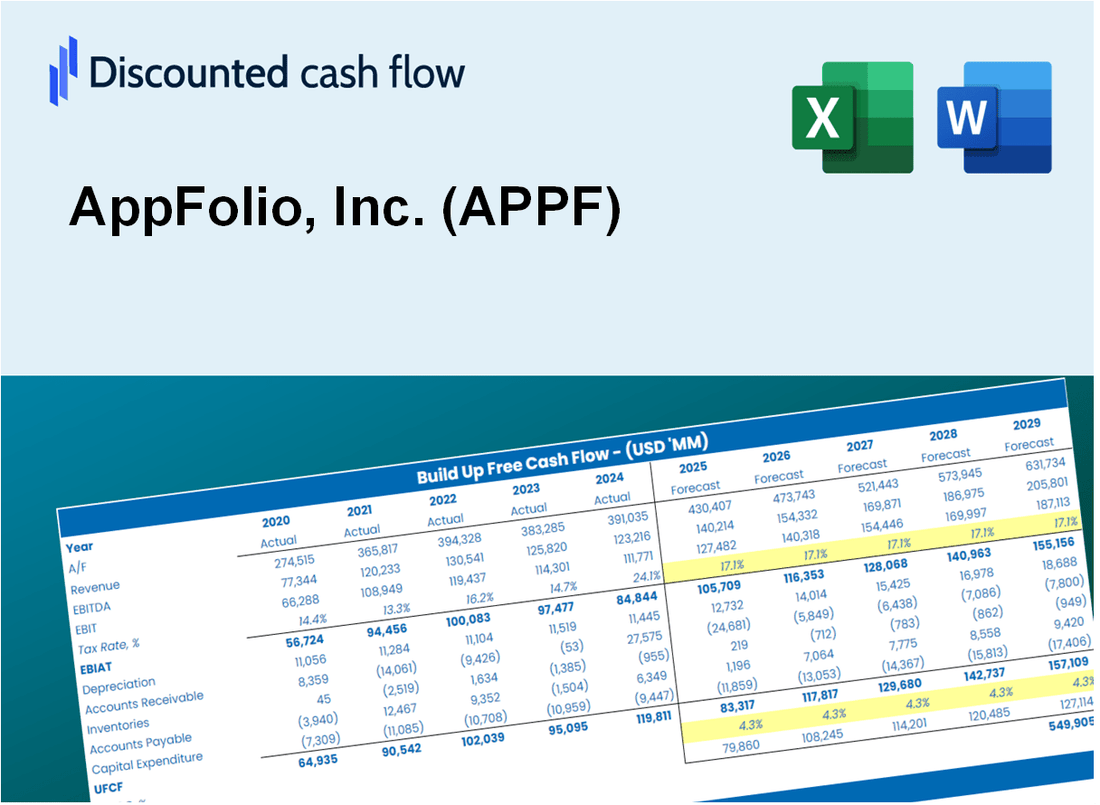
Valoración DCF de AppFolio, Inc. (APPF) |
Completamente Editable: Adáptelo A Sus Necesidades En Excel O Sheets
Diseño Profesional: Plantillas Confiables Y Estándares De La Industria
Predeterminadas Para Un Uso Rápido Y Eficiente
Compatible con MAC / PC, completamente desbloqueado
No Se Necesita Experiencia; Fáciles De Seguir
AppFolio, Inc. (APPF) Bundle
¡Obtenga dominio sobre su análisis de valoración de AppFolio, Inc. (APPF) utilizando nuestra sofisticada calculadora DCF! Equipado con datos reales de APPF, esta plantilla de Excel le permite ajustar los pronósticos y supuestos, lo que le permite calcular con precisión el valor intrínseco de AppFolio, Inc. (APPF).
Discounted Cash Flow (DCF) - (USD MM)
| Year | AY1 2020 |
AY2 2021 |
AY3 2022 |
AY4 2023 |
AY5 2024 |
FY1 2025 |
FY2 2026 |
FY3 2027 |
FY4 2028 |
FY5 2029 |
|---|---|---|---|---|---|---|---|---|---|---|
| Revenue | 310.1 | 359.4 | 471.9 | 620.4 | 794.2 | 1,006.1 | 1,274.4 | 1,614.4 | 2,045.0 | 2,590.5 |
| Revenue Growth, % | 0 | 15.9 | 31.31 | 31.48 | 28.01 | 26.68 | 26.68 | 26.68 | 26.68 | 26.68 |
| EBITDA | 17.4 | 20.4 | -38.4 | 30.0 | 169.9 | 59.1 | 74.8 | 94.8 | 120.1 | 152.1 |
| EBITDA, % | 5.61 | 5.66 | -8.13 | 4.83 | 21.39 | 5.87 | 5.87 | 5.87 | 5.87 | 5.87 |
| Depreciation | 30.5 | 34.0 | 36.3 | 28.6 | 19.5 | 68.6 | 86.9 | 110.0 | 139.4 | 176.6 |
| Depreciation, % | 9.83 | 9.47 | 7.69 | 4.61 | 2.46 | 6.82 | 6.82 | 6.82 | 6.82 | 6.82 |
| EBIT | -13.1 | -13.7 | -74.7 | 1.3 | 150.3 | -9.5 | -12.0 | -15.2 | -19.3 | -24.4 |
| EBIT, % | -4.23 | -3.81 | -15.82 | 0.21259 | 18.93 | -0.94374 | -0.94374 | -0.94374 | -0.94374 | -0.94374 |
| Total Cash | 168.5 | 122.4 | 160.1 | 211.7 | 278.2 | 385.3 | 488.1 | 618.3 | 783.2 | 992.2 |
| Total Cash, percent | .0 | .0 | .0 | .0 | .0 | .0 | .0 | .0 | .0 | .0 |
| Account Receivables | 10.1 | 12.6 | 16.5 | 20.7 | 24.3 | 33.5 | 42.4 | 53.8 | 68.1 | 86.3 |
| Account Receivables, % | 3.24 | 3.5 | 3.5 | 3.34 | 3.07 | 3.33 | 3.33 | 3.33 | 3.33 | 3.33 |
| Inventories | .0 | .0 | .0 | .0 | .0 | .0 | .0 | .0 | .0 | .0 |
| Inventories, % | 0 | 0 | 0 | 0 | 0 | 0 | 0 | 0 | 0 | 0 |
| Accounts Payable | 1.0 | 1.7 | 2.5 | 1.1 | 2.4 | 3.7 | 4.6 | 5.9 | 7.4 | 9.4 |
| Accounts Payable, % | 0.33542 | 0.47416 | 0.52407 | 0.1839 | 0.29942 | 0.3634 | 0.3634 | 0.3634 | 0.3634 | 0.3634 |
| Capital Expenditure | -45.1 | -32.7 | -21.2 | -9.0 | -2.0 | -60.1 | -76.1 | -96.4 | -122.1 | -154.7 |
| Capital Expenditure, % | -14.54 | -9.1 | -4.5 | -1.46 | -0.25384 | -5.97 | -5.97 | -5.97 | -5.97 | -5.97 |
| Tax Rate, % | -35.75 | -35.75 | -35.75 | -35.75 | -35.75 | -35.75 | -35.75 | -35.75 | -35.75 | -35.75 |
| EBITAT | -10.5 | -8.1 | -76.2 | .4 | 204.1 | -7.1 | -9.0 | -11.4 | -14.4 | -18.3 |
| Depreciation | ||||||||||
| Changes in Account Receivables | ||||||||||
| Changes in Inventories | ||||||||||
| Changes in Accounts Payable | ||||||||||
| Capital Expenditure | ||||||||||
| UFCF | -34.1 | -8.7 | -64.3 | 14.5 | 219.2 | -6.5 | -6.2 | -7.8 | -9.9 | -12.6 |
| WACC, % | 7.49 | 7.49 | 7.5 | 7.49 | 7.5 | 7.49 | 7.49 | 7.49 | 7.49 | 7.49 |
| PV UFCF | ||||||||||
| SUM PV UFCF | -33.9 | |||||||||
| Long Term Growth Rate, % | 2.00 | |||||||||
| Free cash flow (T + 1) | -13 | |||||||||
| Terminal Value | -233 | |||||||||
| Present Terminal Value | -163 | |||||||||
| Enterprise Value | -196 | |||||||||
| Net Debt | -1 | |||||||||
| Equity Value | -196 | |||||||||
| Diluted Shares Outstanding, MM | 37 | |||||||||
| Equity Value Per Share | -5.32 |
What You Will Get
- Editable Forecast Inputs: Easily adjust assumptions (growth %, margins, WACC) to explore various scenarios.
- Real-World Data: AppFolio, Inc.'s (APPF) financial data pre-loaded to kickstart your analysis.
- Automatic DCF Outputs: The template computes Net Present Value (NPV) and intrinsic value automatically.
- Customizable and Professional: A refined Excel model that can be tailored to your valuation requirements.
- Built for Analysts and Investors: Perfect for evaluating projections, confirming strategies, and enhancing efficiency.
Key Features
- Comprehensive AppFolio Financials: Gain access to reliable pre-loaded historical data and forward-looking projections.
- Adjustable Forecast Parameters: Modify highlighted cells for metrics like WACC, growth rates, and profit margins.
- Real-Time Calculations: Automatic adjustments to DCF, Net Present Value (NPV), and cash flow assessments.
- Interactive Dashboard: User-friendly charts and summaries to help visualize your valuation findings.
- Suitable for All Experience Levels: A straightforward, intuitive layout designed for investors, CFOs, and consultants alike.
How It Works
- Download: Get the pre-configured Excel file containing AppFolio’s financial data.
- Customize: Modify projections, such as revenue growth rates, EBITDA %, and WACC.
- Update Automatically: The intrinsic value and NPV calculations refresh in real-time.
- Test Scenarios: Develop various forecasts and analyze results immediately.
- Make Decisions: Leverage the valuation insights to inform your investment choices.
Why Choose This Calculator for AppFolio, Inc. (APPF)?
- All-in-One Solution: Offers DCF, WACC, and financial ratio analyses tailored for AppFolio, Inc. (APPF).
- Flexible Inputs: Modify yellow-highlighted cells to explore different financial scenarios.
- In-Depth Analysis: Automatically computes AppFolio’s intrinsic value and Net Present Value.
- Data-Rich Environment: Comes with historical and projected data for reliable analysis.
- High-Quality Standards: Perfect for financial analysts, investors, and business consultants focusing on AppFolio, Inc. (APPF).
Who Should Use This Product?
- Property Managers: Enhance operational efficiency by managing properties seamlessly with AppFolio's tools.
- Real Estate Investors: Make informed investment decisions by analyzing property performance metrics.
- Accountants: Simplify financial reporting and bookkeeping processes for real estate portfolios.
- Landlords: Streamline tenant communications and payment processes for a better rental experience.
- Real Estate Students: Acquire practical knowledge of property management practices through hands-on experience.
What the Template Contains
- Comprehensive DCF Model: Editable template featuring in-depth valuation calculations.
- Real-World Data: AppFolio, Inc.'s (APPF) historical and projected financials preloaded for analysis.
- Customizable Parameters: Modify WACC, growth rates, and tax assumptions to explore various scenarios.
- Financial Statements: Complete annual and quarterly breakdowns for enhanced insights.
- Key Ratios: Integrated analysis for profitability, efficiency, and leverage metrics.
- Dashboard with Visual Outputs: Charts and tables providing clear, actionable results.
Disclaimer
All information, articles, and product details provided on this website are for general informational and educational purposes only. We do not claim any ownership over, nor do we intend to infringe upon, any trademarks, copyrights, logos, brand names, or other intellectual property mentioned or depicted on this site. Such intellectual property remains the property of its respective owners, and any references here are made solely for identification or informational purposes, without implying any affiliation, endorsement, or partnership.
We make no representations or warranties, express or implied, regarding the accuracy, completeness, or suitability of any content or products presented. Nothing on this website should be construed as legal, tax, investment, financial, medical, or other professional advice. In addition, no part of this site—including articles or product references—constitutes a solicitation, recommendation, endorsement, advertisement, or offer to buy or sell any securities, franchises, or other financial instruments, particularly in jurisdictions where such activity would be unlawful.
All content is of a general nature and may not address the specific circumstances of any individual or entity. It is not a substitute for professional advice or services. Any actions you take based on the information provided here are strictly at your own risk. You accept full responsibility for any decisions or outcomes arising from your use of this website and agree to release us from any liability in connection with your use of, or reliance upon, the content or products found herein.