
|
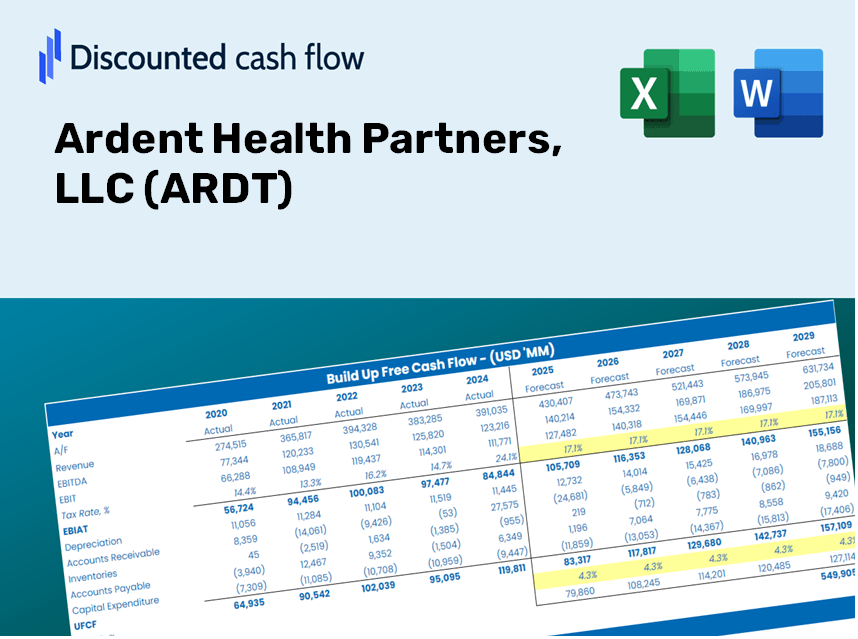
Valoración de DCF de Ardent Health Partners, LLC (ARDT) |
Completamente Editable: Adáptelo A Sus Necesidades En Excel O Sheets
Diseño Profesional: Plantillas Confiables Y Estándares De La Industria
Predeterminadas Para Un Uso Rápido Y Eficiente
Compatible con MAC / PC, completamente desbloqueado
No Se Necesita Experiencia; Fáciles De Seguir
Ardent Health Partners, LLC (ARDT) Bundle
¿Buscas evaluar el valor intrínseco de Ardent Health Partners, LLC? Nuestra calculadora DCF (ARDT) integra datos del mundo real con amplias opciones de personalización, lo que le permite adaptar los pronósticos y mejorar sus estrategias de inversión.
Discounted Cash Flow (DCF) - (USD MM)
| Year | AY1 2018 |
AY2 2021 |
AY3 2022 |
AY4 2023 |
AY5 2024 |
FY1 2025 |
FY2 2026 |
FY3 2027 |
FY4 2028 |
FY5 2029 |
|---|---|---|---|---|---|---|---|---|---|---|
| Revenue | 4,161.9 | 4,870.4 | 5,129.7 | 5,409.5 | 5,966.1 | 6,280.3 | 6,611.1 | 6,959.3 | 7,325.8 | 7,711.6 |
| Revenue Growth, % | 0 | 0 | 5.32 | 5.45 | 10.29 | 5.27 | 5.27 | 5.27 | 5.27 | 5.27 |
| EBITDA | 245.8 | 526.9 | 531.7 | 350.0 | 574.9 | 542.6 | 571.1 | 601.2 | 632.9 | 666.2 |
| EBITDA, % | 5.9 | 10.82 | 10.37 | 6.47 | 9.64 | 8.64 | 8.64 | 8.64 | 8.64 | 8.64 |
| Depreciation | 143.2 | 137.2 | 138.2 | 140.8 | 146.3 | 175.9 | 185.2 | 195.0 | 205.2 | 216.0 |
| Depreciation, % | 3.44 | 2.82 | 2.69 | 2.6 | 2.45 | 2.8 | 2.8 | 2.8 | 2.8 | 2.8 |
| EBIT | 102.6 | 389.7 | 393.5 | 209.2 | 428.6 | 366.6 | 385.9 | 406.3 | 427.7 | 450.2 |
| EBIT, % | 2.46 | 8 | 7.67 | 3.87 | 7.18 | 5.84 | 5.84 | 5.84 | 5.84 | 5.84 |
| Total Cash | 59.7 | 456.1 | 437.6 | 556.8 | ||||||
| Total Cash, percent | .0 | .0 | .0 | .0 | ||||||
| Account Receivables | 529.1 | 612.0 | 775.5 | 743.0 | ||||||
| Account Receivables, % | 12.71 | 11.93 | 14.34 | 12.45 | ||||||
| Inventories | 84.8 | 107.2 | 105.5 | 115.1 | ||||||
| Inventories, % | 2.04 | 2.09 | 1.95 | 1.93 | ||||||
| Accounts Payable | 230.4 | 320.8 | 474.5 | 401.2 | ||||||
| Accounts Payable, % | 5.53 | 6.25 | 8.77 | 6.73 | ||||||
| Capital Expenditure | -160.7 | -139.0 | -151.1 | -137.4 | -187.5 | -192.7 | -202.9 | -213.6 | -224.8 | -236.6 |
| Capital Expenditure, % | -3.86 | -2.85 | -2.95 | -2.54 | -3.14 | -3.07 | -3.07 | -3.07 | -3.07 | -3.07 |
| Tax Rate, % | 42.06 | 42.06 | 42.06 | 42.06 | 42.06 | 42.06 | 42.06 | 42.06 | 42.06 | 42.06 |
| EBITAT | 128.0 | 203.2 | 238.7 | 69.4 | 248.3 | 222.8 | 234.6 | 246.9 | 259.9 | 273.6 |
| Depreciation | ||||||||||
| Changes in Account Receivables | ||||||||||
| Changes in Inventories | ||||||||||
| Changes in Accounts Payable | ||||||||||
| Capital Expenditure | ||||||||||
| UFCF | -273.1 | 585.0 | -172.6 | 64.7 | 156.6 | 662.9 | 216.9 | 228.3 | 240.3 | 253.0 |
| WACC, % | 4.44 | 3.27 | 3.47 | 2.8 | 3.41 | 3.48 | 3.48 | 3.48 | 3.48 | 3.48 |
| PV UFCF | ||||||||||
| SUM PV UFCF | 1,472.2 | |||||||||
| Long Term Growth Rate, % | 2.00 | |||||||||
| Free cash flow (T + 1) | 258 | |||||||||
| Terminal Value | 17,466 | |||||||||
| Present Terminal Value | 14,722 | |||||||||
| Enterprise Value | 16,194 | |||||||||
| Net Debt | 1,725 | |||||||||
| Equity Value | 14,469 | |||||||||
| Diluted Shares Outstanding, MM | 133 | |||||||||
| Equity Value Per Share | 109.00 |
What You Will Receive
- Genuine Ardent Data: Comprehensive financial metrics – including revenue and EBIT – derived from actual and forecasted numbers.
- Comprehensive Customization: Modify all essential parameters (yellow cells) such as WACC, growth %, and tax rates.
- Immediate Valuation Adjustments: Automatic recalculations to assess the effect of changes on Ardent Health Partners' fair value.
- Flexible Excel Template: Designed for rapid modifications, scenario analyses, and in-depth projections.
- Efficient and Precise: Avoid the hassle of building models from the ground up while ensuring accuracy and adaptability.
Key Features
- 🔍 Real-Life ARDT Financials: Pre-filled historical and projected data for Ardent Health Partners, LLC.
- ✏️ Fully Customizable Inputs: Modify all essential parameters (yellow cells) such as WACC, growth %, and tax rates.
- 📊 Professional DCF Valuation: Integrated formulas calculate the intrinsic value of Ardent Health Partners, LLC using the Discounted Cash Flow method.
- ⚡ Instant Results: View Ardent’s valuation immediately after adjustments are made.
- Scenario Analysis: Analyze and compare results for different financial assumptions side-by-side.
How It Functions
- Step 1: Download the Excel spreadsheet.
- Step 2: Examine the pre-filled data for Ardent Health Partners, LLC (ARDT) (historical and projected).
- Step 3: Modify key assumptions (highlighted in yellow) based on your findings.
- Step 4: Observe the automatic updates reflecting Ardent Health Partners, LLC's (ARDT) intrinsic value.
- Step 5: Utilize the results for investment decisions or reporting purposes.
Why Use the Ardent Health Calculator?
- Precision: Utilizes real Ardent Health financial data for utmost accuracy.
- Customizability: Built for users to easily adjust and experiment with inputs.
- Efficiency: Eliminate the need to construct a DCF model from the ground up.
- Expert-Level: Crafted with the expertise and functionality expected by CFOs.
- Intuitive: Simple to navigate, perfect for users with limited financial modeling skills.
Who Might Benefit From This Product?
- Investors: Empower your investment choices with a sophisticated valuation tool from Ardent Health Partners (ARDT).
- Financial Analysts: Streamline your workflow with a customizable, pre-built DCF model tailored for your needs.
- Consultants: Effortlessly modify the template for client presentations or detailed reports.
- Finance Enthusiasts: Enhance your comprehension of valuation methods through real-world applications.
- Educators and Students: Utilize this resource as a hands-on learning aid in finance-focused courses.
Contents of the Template
- Preloaded ARDT Data: Historical and projected financial metrics, including revenue, EBIT, and capital expenditures.
- DCF and WACC Models: High-quality templates for calculating intrinsic value and Weighted Average Cost of Capital.
- Editable Inputs: Yellow-highlighted cells for customizing revenue growth, tax rates, and discount rates.
- Financial Statements: Detailed annual and quarterly financial reports for in-depth analysis.
- Key Ratios: Profitability, leverage, and efficiency ratios to assess performance.
- Dashboard and Charts: Visual representations of valuation results and underlying assumptions.
Disclaimer
All information, articles, and product details provided on this website are for general informational and educational purposes only. We do not claim any ownership over, nor do we intend to infringe upon, any trademarks, copyrights, logos, brand names, or other intellectual property mentioned or depicted on this site. Such intellectual property remains the property of its respective owners, and any references here are made solely for identification or informational purposes, without implying any affiliation, endorsement, or partnership.
We make no representations or warranties, express or implied, regarding the accuracy, completeness, or suitability of any content or products presented. Nothing on this website should be construed as legal, tax, investment, financial, medical, or other professional advice. In addition, no part of this site—including articles or product references—constitutes a solicitation, recommendation, endorsement, advertisement, or offer to buy or sell any securities, franchises, or other financial instruments, particularly in jurisdictions where such activity would be unlawful.
All content is of a general nature and may not address the specific circumstances of any individual or entity. It is not a substitute for professional advice or services. Any actions you take based on the information provided here are strictly at your own risk. You accept full responsibility for any decisions or outcomes arising from your use of this website and agree to release us from any liability in connection with your use of, or reliance upon, the content or products found herein.