
|
Ark Restaurants Corp. (ARKR): Análisis de 5 Fuerzas [Actualizado en Ene-2025] |
Completamente Editable: Adáptelo A Sus Necesidades En Excel O Sheets
Diseño Profesional: Plantillas Confiables Y Estándares De La Industria
Predeterminadas Para Un Uso Rápido Y Eficiente
Compatible con MAC / PC, completamente desbloqueado
No Se Necesita Experiencia; Fáciles De Seguir
Ark Restaurants Corp. (ARKR) Bundle
Sumérgete en el panorama estratégico de Ark Restaurants Corp. (ARKR), donde el mundo culinario cumple con la compleja dinámica del mercado. En este análisis de profundidad, desentrañaremos la intrincada red de fuerzas competitivas que dan forma a la estrategia comercial del gigante del restaurante en 2024. Desde el delicado equilibrio de las negociaciones de proveedores hasta el feroz campo de batalla de las preferencias del cliente, esta exploración revela los factores críticos que impulsan el éxito en una de las industrias más desafiantes. Prepárese para descubrir los mecanismos ocultos que determinan el posicionamiento competitivo de ARKR y el potencial de crecimiento en un mercado gastronómico en constante evolución.
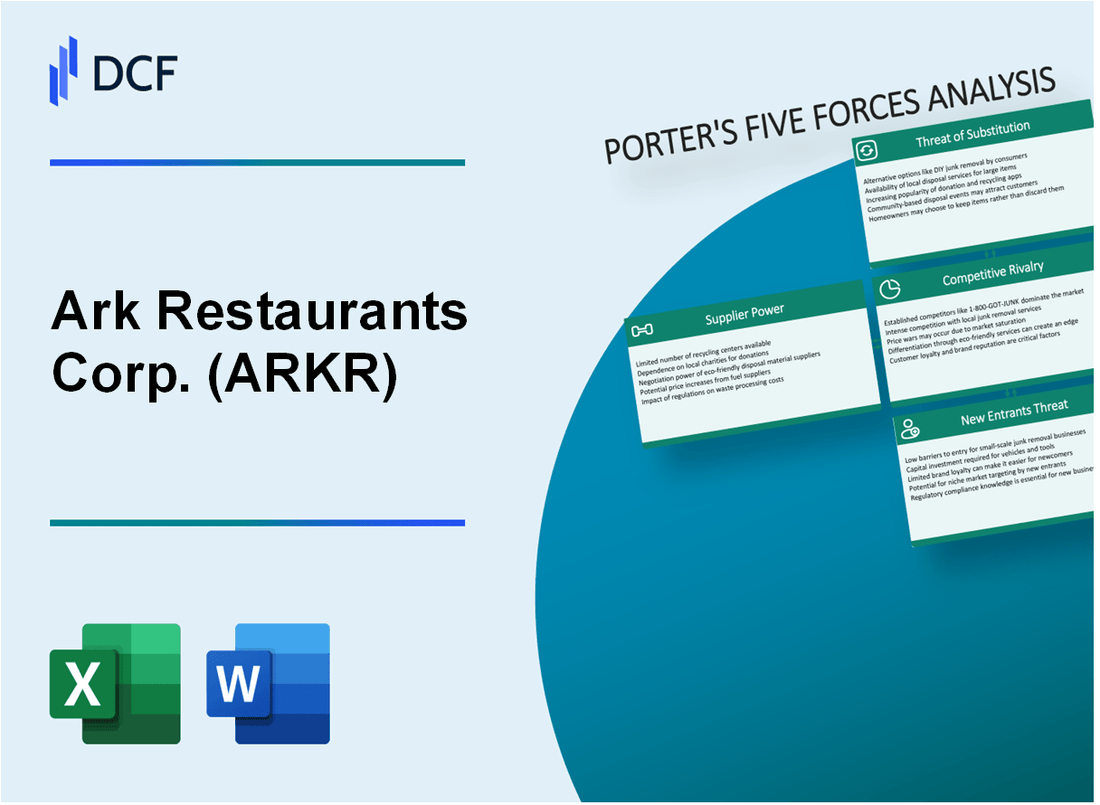
Ark Restaurants Corp. (ARKR) - Las cinco fuerzas de Porter: poder de negociación de los proveedores
Número limitado de proveedores de alimentos y bebidas
Según la Asociación Nacional de Restaurantes, la cadena de suministro del servicio de alimentos incluye aproximadamente 2,500 distribuidores en todo el país. Ark Restaurants Corp. Fuentes de una piscina limitada de aproximadamente 12-15 proveedores primarios de alimentos y bebidas.
| Categoría de proveedor | Número de proveedores | Valor de adquisición anual |
|---|---|---|
| Proveedores de carne | 3-4 | $ 4.2 millones |
| Proveedores de productos | 4-5 | $ 3.7 millones |
| Proveedores de mariscos | 2-3 | $ 2.9 millones |
Dependencia de ingredientes de calidad
Los conceptos de restaurantes de Arkr requieren ingredientes especializados de alta calidad, que limita las alternativas de proveedores.
- El abastecimiento de ingredientes especializados aumenta el poder de negociación del proveedor
- Los costos de ingredientes premium representan el 35-40% de los gastos totales de adquisición de alimentos
- Flexibilidad geográfica limitada en el abastecimiento
Volatilidad del precio del mercado de productos alimenticios
Los datos del USDA indican fluctuaciones significativas de precios en productos alimenticios clave:
| Producto | Rango de volatilidad de precios (2023) | Impacto en ARKR |
|---|---|---|
| Carne de res | 12-18% fluctuación | Alto riesgo de costo de adquisición |
| Mariscos | 15-22% fluctuación | Presión significativa de precios de menú |
| Producir | 8-14% fluctuación | Desafío de gestión de costos moderado |
Cadena de suministro de equipos de restaurantes especializados
El mercado comercial de equipos de cocina muestra el paisaje de proveedores concentrados:
- 3-4 Proveedores de equipos de restaurantes nacionales principales
- Costos de reemplazo del equipo: $ 250,000- $ 350,000 anualmente
- Alternativas de fabricante limitadas para equipos especializados
Restricciones de abastecimiento de ingredientes geográficos
ARKR opera en 6 estados, con ubicaciones principales en Nueva York, Nevada y Florida. Las restricciones geográficas impactan la adquisición de ingredientes frescos.
| Región | Disponibilidad del proveedor local | Complejidad de abastecimiento |
|---|---|---|
| Nueva York | Alto | Bajo |
| Nevada | Medio | Alto |
| Florida | Medio | Medio |
Ark Restaurants Corp. (ARKR) - Cinco fuerzas de Porter: poder de negociación de los clientes
Análisis de base de clientes diversos
Ark Restaurants Corp. opera 20 restaurantes en múltiples conceptos, con 14 ubicados en centros urbanos y 6 en ubicaciones de destino. Los segmentos de los clientes incluyen:
- Cena corporativa: 42% de la base total de clientes
- Cena informal: 33% de la base total de clientes
- Clientes de eventos especiales: 25% de la base total de clientes
Métricas de sensibilidad de precios
| Gama de precios | Porcentaje de segmento de clientes | Gasto promedio |
|---|---|---|
| $ 15- $ 25 por persona | 45% | $19.50 |
| $ 26- $ 40 por persona | 35% | $32.75 |
| $ 41- $ 60 por persona | 20% | $52.25 |
Expectativas del cliente
Calificaciones de satisfacción del cliente para Ark Restaurants Corp. Restaurantes:
- Experiencia gastronómica general: calificación 4.2/5
- Calidad del servicio: calificación 4.3/5
- Calidad de los alimentos: calificación 4.1/5
Rendimiento del programa de fidelización
Estadísticas del programa de fidelización de los restaurantes Ark:
- Miembros de lealtad total: 78,500
- Tasa de cliente repetida: 62%
- Gasto anual promedio por miembro de lealtad: $ 325
Tendencias de preferencia del consumidor
| Concepto de restaurante | Porcentaje de preferencia del cliente |
|---|---|
| Experiencias gastronómicas únicas | 38% |
| Conceptos tradicionales de restaurantes | 32% |
| Fusión/cocina innovadora | 30% |
Ark Restaurants Corp. (ARKR) - Cinco fuerzas de Porter: rivalidad competitiva
Panorama de la competencia del mercado
A partir del cuarto trimestre de 2023, Ark Restaurants Corp. opera en un mercado de restaurantes altamente competitivo con las siguientes métricas competitivas:
| Métrico competitivo | Datos numéricos |
|---|---|
| Conceptos totales de restaurantes | 18 marcas de restaurantes |
| Mercados geográficos | 7 áreas metropolitanas primarias |
| Ingresos anuales (2023) | $ 152.3 millones |
| Cuota de mercado en las ciudades objetivo | 2.7% en Nueva York |
Desafíos competitivos
Presiones competitivas de tecla:
- Márgenes de ganancias de la industria de restaurantes con un promedio de 3-5%
- Altos costos operativos en los mercados urbanos
- Intensa competencia de cadenas de restaurantes nacionales y locales
- Las preferencias gastronómicas de consumo que cambian rápidamente
Posicionamiento competitivo
Las estrategias de diferenciación competitiva incluyen:
- Ubicaciones únicas de restaurantes en áreas de alto tráfico
- Diversos temas de restaurantes dirigidos a segmentos de mercado específicos
- Presencia estratégica en los mercados de hospitalidad de Las Vegas y Nueva York
| Factor competitivo | Rendimiento de arkr |
|---|---|
| Número de competidores | Más de 45 competidores directos |
| Concentración de mercado | Sector de restaurantes fragmentado |
| Rentabilidad promedio del restaurante | 4.2% Margen neto |
Ark Restaurants Corp. (ARKR) - Cinco fuerzas de Porter: amenaza de sustitutos
Cultivo de la entrega de alimentos y las opciones de comida para llevar
A partir de 2023, el mercado de entrega de alimentos en los Estados Unidos estaba valorado en $ 266.6 mil millones. Doordash poseía una participación de mercado del 59%, con Uber come al 24% y Grubhub al 11%. Ark Restaurants enfrenta una importante competencia de estas plataformas digitales.
| Plataforma de entrega de alimentos | Cuota de mercado | Ingresos anuales |
|---|---|---|
| Doordash | 59% | $ 6.58 mil millones (2022) |
| Uber come | 24% | $ 2.9 mil millones (2022) |
| Grubhub | 11% | $ 1.4 mil millones (2022) |
Aumento de las tendencias de cocina casera
En 2022, el 93% de los estadounidenses informaron cocinar en casa, con un 53% de cocción más que antes de la pandemia. El mercado de cocina casera creció un 7,2% en 2022.
- Gasto promedio de hogares en comestibles: $ 5,259 por año
- Tiempo de preparación de comidas: promedio de 37 minutos por comida
- Frecuencia de cocina doméstica: 4-5 veces por semana por hogar
Aparición de servicios de kit de comidas
El mercado del kit de comidas alcanzó los $ 19.92 mil millones en 2022, con un crecimiento proyectado a $ 42.22 mil millones para 2027.
| Compañía de kits de comidas | Cuota de mercado | Ingresos anuales |
|---|---|---|
| Hellofresh | 35% | $ 2.1 mil millones (2022) |
| Delantal azul | 12% | $ 462 millones (2022) |
Creciente popularidad de las alternativas de comidas informales
Mercado de restaurantes casuales rápidos valorado en $ 187.7 mil millones en 2022, creciendo al 10.5% anual.
- Ingresos anuales de Chipotle: $ 8.6 mil millones (2022)
- Ingresos anuales de Panera Bread: $ 5.2 mil millones (2022)
- Precio promedio de comida rápida y casera: $ 12.50
Plataformas digitales que ofrecen experiencias gastronómicas
Las plataformas de reserva de restaurantes en línea generaron $ 1.2 mil millones en ingresos en 2022.
| Plataforma | Usuarios anuales | Ingresos anuales |
|---|---|---|
| Áviente | 60 millones | $ 540 millones (2022) |
| Resy | 15 millones | $ 180 millones (2022) |
Ark Restaurants Corp. (ARKR) - Cinco fuerzas de Porter: amenaza de nuevos participantes
Altos requisitos de capital inicial para establecimientos de restaurantes
Costos promedio de inicio del restaurante: $ 275,000 a $ 425,000 para una sola ubicación. Ark Restaurants Corp. requiere aproximadamente $ 3.2 millones en inversión de capital inicial por establecimiento de restaurantes.
| Categoría de gastos de capital | Costo promedio |
|---|---|
| Equipo de cocina | $85,000 |
| Mejoras de arrendamiento | $150,000 |
| Inventario inicial | $40,000 |
| Gastos operativos del primer mes | $50,000 |
Entorno regulatorio complejo
Costos de cumplimiento de la industria de restaurantes: aproximadamente $ 12,000 a $ 25,000 anuales por ubicación para licencias, permisos de salud y requisitos reglamentarios.
Costos de inicio significativos para la infraestructura de restaurantes
- Construcción de cocina comercial: $ 200 - $ 250 por pie cuadrado
- Equipo de cocina profesional: $ 50,000 - $ 150,000
- Inventario inicial de alimentos: $ 30,000 - $ 45,000
Fuerte reconocimiento de marca de los actores del mercado existentes
ARK Restaurants Corp. Valoración del mercado: $ 84.5 millones a partir de 2023, con presencia de marca establecida en múltiples segmentos de restaurantes.
Desafíos locales de zonificación y licencia
| Costo de licencia | Duración promedio |
|---|---|
| Licencia de negocio de restaurantes | $ 100 - $ 500 anualmente |
| Permiso de salud | $ 200 - $ 1,000 anualmente |
| Licencia de licor | $ 12,000 - $ 400,000 dependiendo de la ubicación |
Ark Restaurants Corp. (ARKR) - Porter's Five Forces: Competitive rivalry
The competitive rivalry facing Ark Restaurants Corp. is intense, rooted in a fragmented US dining landscape where differentiation is hard-won. You are competing not just with other local spots, but with national players whose scale can absorb shocks better. This rivalry forces constant pressure on pricing and operational efficiency.
ARKR operates in a hyper-competitive US dining landscape against diverse companies like ONE Group Hospitality and Full House Resorts. To put this into perspective, Ark Restaurants Corp. reported trailing twelve-month revenue of over $171.83 million as of June 2025. However, looking at peers, The ONE Group Hospitality reported trailing twelve-month revenue of $820.59 million as of September 2025, and Full House Resorts posted Q2 2025 revenue of $73.9 million. This shows ARKR is operating against both larger, more diversified entities and other focused competitors in a fragmented market.
High fixed costs, like rent and labor, intensify the pressure to maintain volume and lower prices. The broader industry data for late 2025 shows just how tight the margins are, which directly fuels competitive pricing battles. For instance, labor costs generally account for 25-40% of sales across the industry, with casual dining sitting near 33.2%. Furthermore, Cost of Goods Sold (COGS) now eats up over 40% of revenue. When your primary costs are this high, any dip in volume forces you to fight harder on price just to cover the rent and payroll.
The market fragmentation means that success is highly localized, and operational failures in one area can significantly skew overall results. Ark Restaurants Corp. has faced significant operational challenges in specific markets, like the difficult environment in Washington D.C. This is not just a minor headwind; in Q3 2025, the company took a non-cash asset impairment charge of $4.70 million at its Sequoia restaurant in D.C. due to low visitor numbers and market weakness.
The intensity of rivalry is best understood by comparing key financial metrics across the landscape, showing where Ark Restaurants Corp. stands relative to its peers in terms of scale and recent performance:
| Metric | Ark Restaurants Corp. (ARKR) | The ONE Group Hospitality (STKS) | Full House Resorts (FLL) |
|---|---|---|---|
| Latest TTM/Annual Revenue | $171.83 million (TTM as of June 2025) | $820.59 million (TTM as of Sept 2025) | Not provided (Q2 2025 Revenue: $73.9 million) |
| Latest Quarterly Revenue | $43.72 million (Q3 2025) | $207.4 million (Q2 2025) | $73.9 million (Q2 2025) |
| Reported Industry Labor Cost Range | 25% to 40% of sales | ||
| Reported Industry Net Pre-Tax Margin | Approximately ~5% | ||
The pressure from competitors is compounded by the need to maintain volume to cover these high structural costs. You see this play out in the industry's general response:
- Nearly one-half of operators plan to add new discounts or value promotions to drive traffic.
- For full-service restaurants, the median labor cost was 36.5% of sales in 2022.
- 70% of operators still struggle to fill positions, keeping turnover high at 75-80% annually.
- The D.C. market difficulty for Ark Restaurants Corp. is evidenced by the $4.70 million impairment at Sequoia in Q3 2025.
Ark Restaurants Corp. (ARKR) - Porter's Five Forces: Threat of substitutes
You're looking at the competitive landscape for Ark Restaurants Corp. (ARKR) and the threat of substitutes is definitely a major headwind, especially given the company's mix of full-service, destination dining and its smaller fast-food footprint. Substitutes aren't just other restaurants; they are any alternative that satisfies the customer's need for a meal outside the home or office. The data shows consumers are actively trading down or choosing convenience over the full-service experience that makes up a large part of ARKR's portfolio.
The sheer scale of the substitute market quantifies the pressure. For instance, the U.S. online food delivery market, a direct substitute for dine-in, is projected to reach $74.0 Billion by 2033, showing massive, sustained growth. Furthermore, the fast-casual segment, which blends quality with speed, is estimated to grow by $84.5 Billion in the US between 2025 and 2029, with consumer spending projected at $81.5 billion in 2025 alone. This contrasts sharply with the challenges facing ARKR's full-service venues; for example, their Q3 2025 revenue was $43,715,000, down from $50,396,000 in the prior year's third quarter.
Here's a breakdown of the primary substitute pressures:
- - High availability of diverse substitutes: quick-service, fast-casual, meal kits, and delivery services.
- - Customer preference shift to lower-cost alternatives directly substitutes full-service dining.
- - The company is piloting new fast-food concepts, a direct response to this threat.
- - Catering and private event services face substitution from in-house corporate dining and hotel venues.
The shift in consumer preference is evident in the success of competitors in the substitute categories. While ARKR's LTM revenue as of June 28, 2025, was down -6.88% year-over-year to $171.83M, leading fast-casual chains posted significant same-store sales growth, like 6% for Chipotle in Q3 2025. To counter this, Ark Restaurants Corp. already operates 12 fast food concepts within its portfolio, indicating a long-standing internal strategy to compete in the lower-cost, higher-volume space. However, the company's Chairman noted they remain steadfast in not raising prices, suggesting they are competing on value against these lower-cost alternatives.
The threat is particularly acute for ARKR's higher-margin event and catering business. The company's event business at Bryant Park Grill has reportedly suffered due to ongoing litigation, which had a decided impact on its revenue and cash flow in Q3 2025. This vulnerability is amplified by the availability of alternatives for corporate and private functions:
| Alternative Venue Type | Market Trend Context | ARKR Financial Metric Impacted |
| Online Food Delivery Services | Delivery channels are set to grow at a 13.73% CAGR to 2030. | Overall Total Revenues decreased from $183.55M in FY2024 to $171.83M LTM as of June 2025. |
| Fast-Casual Dining | Consumer spending projected at $81.5 billion in 2025. | Adjusted EBITDA for Q3 2025 was $1,791,000, down from $3,375,000 in Q3 2024. |
| Meal Kit Delivery Services | US Market size expected to reach $14.14 billion in 2025. | Company maintains $12,325,000 in cash and cash equivalents as of June 28, 2025, suggesting a need for liquidity to weather competitive pressures. |
For the catering and private event services, which rely on destination venues like Sequoia and Bryant Park Grill, the substitute threat comes from corporate clients choosing in-house facilities or hotel venues that offer bundled services, bypassing the need for external restaurant event space. This is a qualitative threat, but the financial strain from the Bryant Park litigation highlights the fragility of this revenue stream when facing operational disruptions, making external substitutes more appealing to potential bookers.
Ark Restaurants Corp. (ARKR) - Porter's Five Forces: Threat of new entrants
Securing prime, high-traffic real estate in markets where Ark Restaurants Corp. (ARKR) operates, specifically New York and Las Vegas, presents a substantial initial hurdle for any potential new competitor. The capital outlay required for a comparable footprint is significant.
For a new, full-service establishment aiming for a prime urban location in 2025, total startup expenses can surpass $2 million in high-cost cities like New York. This high barrier is driven by real estate costs, construction, and initial inventory.
| Cost Component (Prime NYC Estimate) | Financial Number/Range (USD) | Source Data Context |
| Average Renovation Cost (NYC) | $200 to $250 per square foot | |
| Estimated Renovation for 2,000 sq ft Space | At least $400,000 | |
| Manhattan/Trendy Brooklyn Annual Rent | $120 to $250 per square foot annually | |
| Estimated 3-Month Security Deposit (2,000 sq ft) | As high as $810,000 (based on $135/sq ft median) | |
| Equipment, Smallwares, and Furniture | $100,000 to $300,000 |
The existing portfolio of Ark Restaurants Corp. is fortified by long-term contractual commitments that effectively block immediate entry into those specific, established venues. For instance, the lease for Gallagher's Steakhouse at the New York-New York Hotel and Casino in Las Vegas runs through December 31, 2032. Similarly, several other Las Vegas venues, including America, Broadway Burger Bar & Grill, and Gonzalez y Gonzalez, have lease extensions secured through December 31, 2033, or December 31, 2034.
Competing against the established brand recognition of Ark Restaurants Corp.'s destination venues requires considerable upfront investment in customer acquisition. New entrants must overcome the established market presence of concepts like Robert in NYC or the strong performance noted at the New York-New York Hotel and Casino operations in Las Vegas. The cost for initial marketing and brand-building is a necessary, though variable, expense to reach a comparable level of consumer awareness.
The precarious nature of prime location access is demonstrated by the recent operational shifts for Ark Restaurants Corp. The company's litigation expenses related to its Bryant Park operations exceeded $800,000 in the third quarter ended June 28, 2025, stemming from the non-renewal of those leases, which expired on April 30, 2025. This event underscores that even long-standing, high-profile locations are not permanently secured, introducing a risk factor that new entrants must also consider when planning for long-term site control.
The barriers to entry are compounded by the financial scale required to operate in this segment, evidenced by Ark Restaurants Corp.'s balance sheet as of June 28, 2025:
- Cash and cash equivalents: $12,325,000.
- Total outstanding debt: $3,859,000.
- Total outstanding operating lease liabilities: $90.6 million.
- Trailing Twelve Month Revenue (as of June 2025): Over $171.83 million.
Disclaimer
All information, articles, and product details provided on this website are for general informational and educational purposes only. We do not claim any ownership over, nor do we intend to infringe upon, any trademarks, copyrights, logos, brand names, or other intellectual property mentioned or depicted on this site. Such intellectual property remains the property of its respective owners, and any references here are made solely for identification or informational purposes, without implying any affiliation, endorsement, or partnership.
We make no representations or warranties, express or implied, regarding the accuracy, completeness, or suitability of any content or products presented. Nothing on this website should be construed as legal, tax, investment, financial, medical, or other professional advice. In addition, no part of this site—including articles or product references—constitutes a solicitation, recommendation, endorsement, advertisement, or offer to buy or sell any securities, franchises, or other financial instruments, particularly in jurisdictions where such activity would be unlawful.
All content is of a general nature and may not address the specific circumstances of any individual or entity. It is not a substitute for professional advice or services. Any actions you take based on the information provided here are strictly at your own risk. You accept full responsibility for any decisions or outcomes arising from your use of this website and agree to release us from any liability in connection with your use of, or reliance upon, the content or products found herein.