
|
Valoración DCF de Aspen Aerogels, Inc. (ASPN) |
Completamente Editable: Adáptelo A Sus Necesidades En Excel O Sheets
Diseño Profesional: Plantillas Confiables Y Estándares De La Industria
Predeterminadas Para Un Uso Rápido Y Eficiente
Compatible con MAC / PC, completamente desbloqueado
No Se Necesita Experiencia; Fáciles De Seguir
Aspen Aerogels, Inc. (ASPN) Bundle
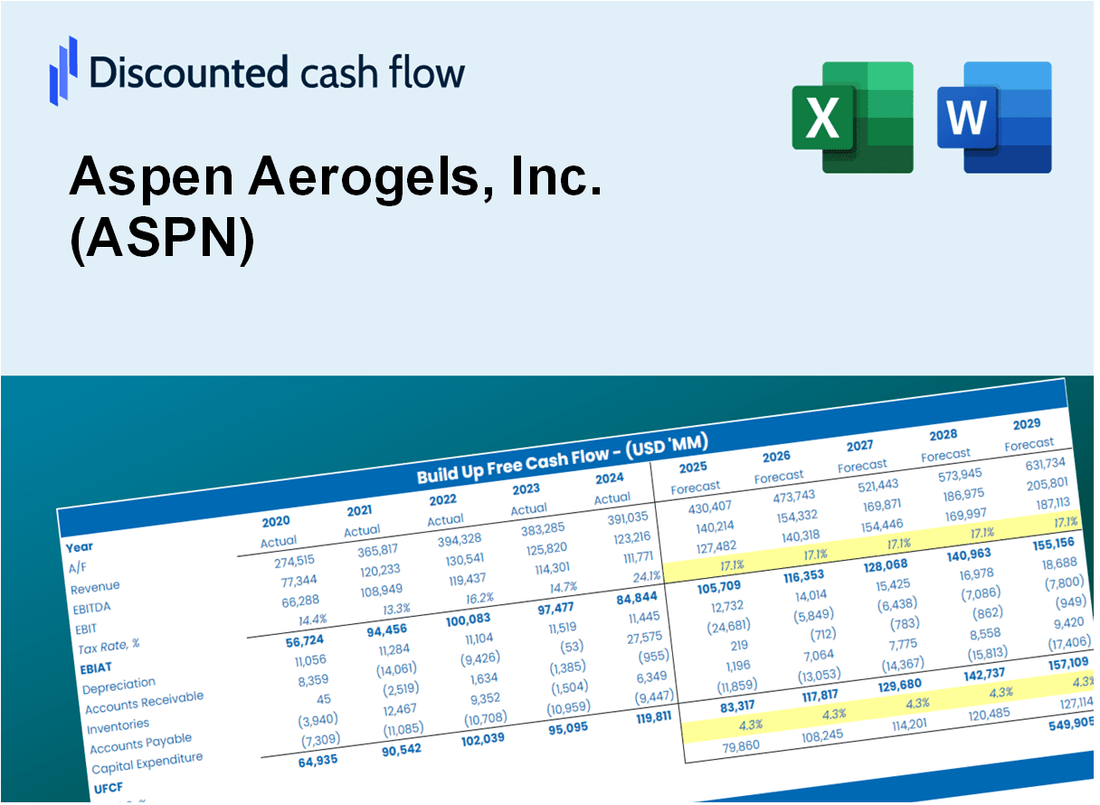
Ya sea que sea un inversor o analista, esta calculadora DCF (ASPN) es su recurso de referencia para una valoración precisa. Cargados con datos reales de Aspen Aerogels, Inc., puede ajustar los pronósticos e inmediatamente observar los efectos.
What You Will Get
- Real Aspen Data: Preloaded financials – from revenue to EBIT – based on actual and projected figures for Aspen Aerogels, Inc. (ASPN).
- Full Customization: Adjust all critical parameters (yellow cells) like WACC, growth %, and tax rates specific to Aspen Aerogels, Inc. (ASPN).
- Instant Valuation Updates: Automatic recalculations to analyze the impact of changes on Aspen Aerogels, Inc. (ASPN)'s fair value.
- Versatile Excel Template: Tailored for quick edits, scenario testing, and detailed projections for Aspen Aerogels, Inc. (ASPN).
- Time-Saving and Accurate: Skip building models from scratch while maintaining precision and flexibility for Aspen Aerogels, Inc. (ASPN).
Key Features
- Comprehensive DCF Calculator: Features detailed unlevered and levered DCF valuation models tailored for Aspen Aerogels, Inc. (ASPN).
- WACC Calculator: Pre-configured Weighted Average Cost of Capital sheet with adjustable inputs specific to the needs of Aspen Aerogels, Inc. (ASPN).
- Customizable Forecast Assumptions: Adjust growth rates, capital expenditures, and discount rates to reflect Aspen Aerogels, Inc. (ASPN) projections.
- Integrated Financial Ratios: Evaluate profitability, leverage, and efficiency ratios relevant to Aspen Aerogels, Inc. (ASPN).
- Interactive Dashboard and Charts: Visual representations summarize essential valuation metrics for efficient analysis of Aspen Aerogels, Inc. (ASPN).
How It Works
- Step 1: Download the Excel file.
- Step 2: Review pre-entered Aspen Aerogels data (historical and projected).
- Step 3: Adjust key assumptions (yellow cells) based on your analysis.
- Step 4: View automatic recalculations for Aspen Aerogels’ intrinsic value.
- Step 5: Use the outputs for investment decisions or reporting.
Why Choose This Calculator for Aspen Aerogels, Inc. (ASPN)?
- All-in-One Solution: Combines DCF, WACC, and financial ratio analyses tailored for Aspen Aerogels.
- Flexible Inputs: Modify the highlighted cells to explore different financial scenarios.
- In-Depth Analysis: Automatically computes Aspen Aerogels’ intrinsic value and Net Present Value.
- Integrated Data: Includes historical and projected data for precise calculations.
- High-Quality Standards: Perfect for financial analysts, investors, and consultants focusing on Aspen Aerogels.
Who Should Use Aspen Aerogels, Inc. (ASPN)?
- Investors: Gain insights into innovative aerogel technologies to make informed investment choices.
- Environmental Engineers: Utilize advanced material properties for sustainable design and applications.
- Research Scientists: Explore cutting-edge aerogel research and development for various industries.
- Manufacturers: Integrate high-performance insulation solutions into product lines for enhanced efficiency.
- Students and Educators: Leverage real-world case studies in materials science and engineering courses.
What the Template Contains
- Historical Data: Includes Aspen Aerogels' past financials and baseline forecasts.
- DCF and Levered DCF Models: Detailed templates to calculate Aspen Aerogels' intrinsic value.
- WACC Sheet: Pre-built calculations for Weighted Average Cost of Capital.
- Editable Inputs: Modify key drivers like growth rates, EBITDA %, and CAPEX assumptions.
- Quarterly and Annual Statements: A complete breakdown of Aspen Aerogels' financials.
- Interactive Dashboard: Visualize valuation results and projections dynamically.
Disclaimer
All information, articles, and product details provided on this website are for general informational and educational purposes only. We do not claim any ownership over, nor do we intend to infringe upon, any trademarks, copyrights, logos, brand names, or other intellectual property mentioned or depicted on this site. Such intellectual property remains the property of its respective owners, and any references here are made solely for identification or informational purposes, without implying any affiliation, endorsement, or partnership.
We make no representations or warranties, express or implied, regarding the accuracy, completeness, or suitability of any content or products presented. Nothing on this website should be construed as legal, tax, investment, financial, medical, or other professional advice. In addition, no part of this site—including articles or product references—constitutes a solicitation, recommendation, endorsement, advertisement, or offer to buy or sell any securities, franchises, or other financial instruments, particularly in jurisdictions where such activity would be unlawful.
All content is of a general nature and may not address the specific circumstances of any individual or entity. It is not a substitute for professional advice or services. Any actions you take based on the information provided here are strictly at your own risk. You accept full responsibility for any decisions or outcomes arising from your use of this website and agree to release us from any liability in connection with your use of, or reliance upon, the content or products found herein.