
|
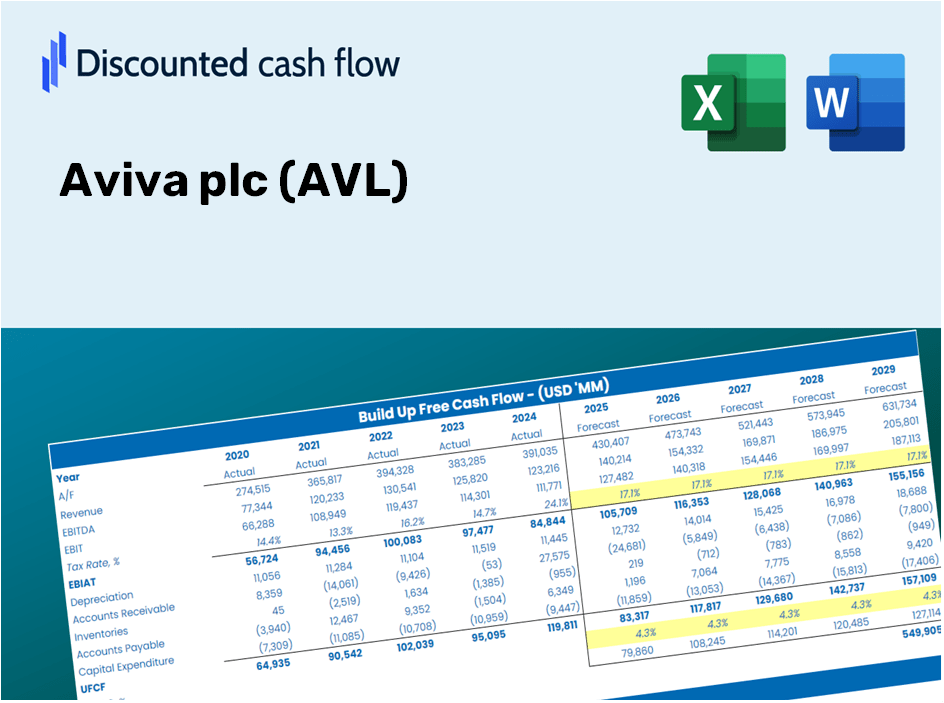
Aviva plc (av.l) valoración DCF |
Completamente Editable: Adáptelo A Sus Necesidades En Excel O Sheets
Diseño Profesional: Plantillas Confiables Y Estándares De La Industria
Predeterminadas Para Un Uso Rápido Y Eficiente
Compatible con MAC / PC, completamente desbloqueado
No Se Necesita Experiencia; Fáciles De Seguir
Aviva plc (AV.L) Bundle
Ya sea que sea un inversor o analista, esta calculadora DCF (AVL) es su herramienta de referencia para una valoración precisa. Cargados con datos reales de Aviva PLC, puede ajustar las previsiones y observar instantáneamente los efectos.
What You Will Receive
- Genuine Aviva Data: Comprehensive financial information – covering everything from revenue to EBIT – derived from actual and forecasted performance.
- Complete Customization: Modify all essential parameters (yellow cells) such as WACC, growth %, and tax rates to suit your analysis.
- Immediate Valuation Updates: Automatic recalculations that allow you to assess how changes affect the fair value of Aviva plc (AVL).
- Flexible Excel Template: Designed for easy modifications, scenario analysis, and thorough forecasts.
- Efficient and Precise: Bypass the need to construct models from scratch while ensuring accuracy and adaptability.
Key Features
- Pre-Loaded Data: Aviva plc’s historical financial reports and pre-filled projections.
- Fully Adjustable Inputs: Customize WACC, tax rates, revenue growth, and EBITDA margins.
- Instant Results: Observe Aviva plc’s intrinsic value recalculating in real time.
- Clear Visual Outputs: Dashboard charts present valuation results and essential metrics.
- Built for Accuracy: A professional tool designed for analysts, investors, and finance professionals.
How It Functions
- Download: Obtain the pre-prepared Excel file featuring Aviva plc’s (AVL) financial data.
- Customize: Tailor forecasts, including revenue growth, EBITDA percentage, and WACC.
- Update Automatically: The intrinsic value and NPV calculations refresh in real-time.
- Test Scenarios: Develop various projections and instantly compare results.
- Make Decisions: Utilize the valuation outcomes to inform your investment strategy.
Why Choose This Calculator for Aviva plc (AVL)?
- Reliable Data: Access authentic financial information for Aviva to ensure accurate valuation outcomes.
- Fully Customizable: Tailor essential variables such as growth rates, WACC, and tax rates to align with your specific forecasts.
- Efficiency Booster: Pre-configured calculations save you the hassle of building from the ground up.
- Professional-Quality Tool: Crafted for investors, analysts, and consultants focused on Aviva plc (AVL).
- Easy to Use: The intuitive design and guided instructions make it accessible for all users.
Who Can Benefit from This Product?
- Finance Students: Discover investment valuation methods and apply them with real-time data.
- Academics: Integrate advanced financial models into your teaching or research projects.
- Investors: Evaluate your strategies and assess valuation results for Aviva plc (AVL) stock.
- Analysts: Optimize your analysis process with a ready-to-use, customizable discounted cash flow model.
- Small Business Owners: Understand the analytical approaches used to evaluate major public companies like Aviva plc (AVL).
Contents of the Template
- Operating and Financial Data: Pre-filled historical data and projections for Aviva plc (AVL), including revenue, EBITDA, EBIT, and capital expenditures.
- WACC Calculation: A specific sheet for calculating the Weighted Average Cost of Capital (WACC), featuring parameters such as Beta, risk-free rate, and share price.
- DCF Valuation (Unlevered and Levered): Customizable Discounted Cash Flow models that illustrate intrinsic value with comprehensive calculations.
- Financial Statements: Pre-loaded annual and quarterly financial statements to facilitate thorough analysis.
- Key Ratios: A collection of profitability, leverage, and efficiency ratios for Aviva plc (AVL).
- Dashboard and Visualizations: A graphical overview of valuation results and assumptions for easy interpretation of data.
Disclaimer
All information, articles, and product details provided on this website are for general informational and educational purposes only. We do not claim any ownership over, nor do we intend to infringe upon, any trademarks, copyrights, logos, brand names, or other intellectual property mentioned or depicted on this site. Such intellectual property remains the property of its respective owners, and any references here are made solely for identification or informational purposes, without implying any affiliation, endorsement, or partnership.
We make no representations or warranties, express or implied, regarding the accuracy, completeness, or suitability of any content or products presented. Nothing on this website should be construed as legal, tax, investment, financial, medical, or other professional advice. In addition, no part of this site—including articles or product references—constitutes a solicitation, recommendation, endorsement, advertisement, or offer to buy or sell any securities, franchises, or other financial instruments, particularly in jurisdictions where such activity would be unlawful.
All content is of a general nature and may not address the specific circumstances of any individual or entity. It is not a substitute for professional advice or services. Any actions you take based on the information provided here are strictly at your own risk. You accept full responsibility for any decisions or outcomes arising from your use of this website and agree to release us from any liability in connection with your use of, or reliance upon, the content or products found herein.