
|
Valoración DCF de Aspira Women's Health Inc. (AWH) |
Completamente Editable: Adáptelo A Sus Necesidades En Excel O Sheets
Diseño Profesional: Plantillas Confiables Y Estándares De La Industria
Predeterminadas Para Un Uso Rápido Y Eficiente
Compatible con MAC / PC, completamente desbloqueado
No Se Necesita Experiencia; Fáciles De Seguir
Aspira Women's Health Inc. (AWH) Bundle
¡Optimice su tiempo y mejore la precisión con nuestra calculadora DCF (AWH)! Utilizando datos reales de Aspira Women's Health Inc. y suposiciones personalizables, esta herramienta le permite pronosticar, analizar y valor (AWH) como un inversor experimentado.
What You Will Get
- Editable Forecast Inputs: Effortlessly modify assumptions (growth %, margins, WACC) to explore various scenarios.
- Real-World Data: Aspira Women's Health Inc. (AWH) financial data pre-filled to kickstart your analysis.
- Automatic DCF Outputs: The template computes Net Present Value (NPV) and intrinsic value automatically.
- Customizable and Professional: A sleek Excel model that adjusts to your valuation requirements.
- Built for Analysts and Investors: Perfect for evaluating projections, confirming strategies, and enhancing efficiency.
Key Features
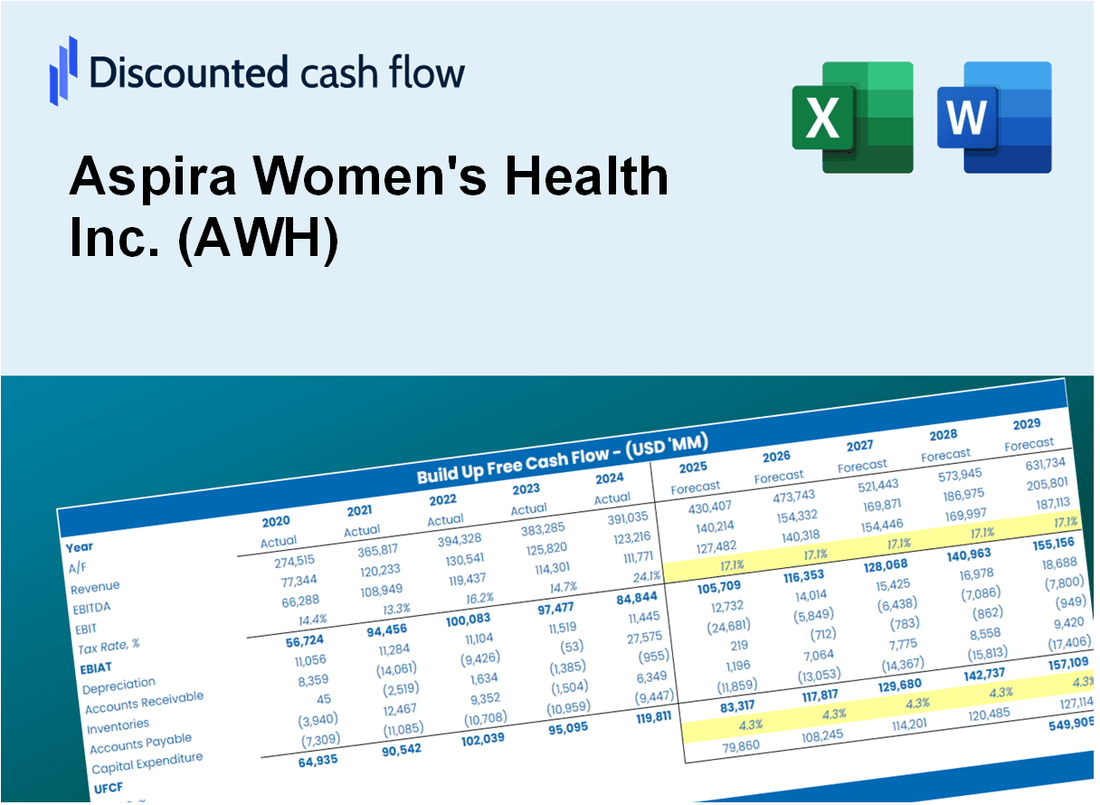
- Comprehensive DCF Calculator: Features detailed unlevered and levered DCF valuation models tailored for Aspira Women's Health Inc. (AWH).
- WACC Calculator: Includes a pre-built Weighted Average Cost of Capital sheet with customizable inputs specific to AWH.
- Customizable Forecast Assumptions: Adjust growth rates, capital expenditures, and discount rates to fit AWH's financial projections.
- Integrated Financial Ratios: Evaluate profitability, leverage, and efficiency ratios relevant to Aspira Women's Health Inc. (AWH).
- Interactive Dashboard and Charts: Visual representations summarize key valuation metrics for streamlined analysis of AWH.
How It Works
- Download the Template: Gain immediate access to the Excel-based AWH DCF Calculator.
- Input Your Assumptions: Modify the yellow-highlighted cells for growth rates, WACC, margins, and other variables.
- Instant Calculations: The model automatically recalculates Aspira Women's Health Inc.'s intrinsic value.
- Test Scenarios: Experiment with different assumptions to assess potential valuation impacts.
- Analyze and Decide: Leverage the results to inform your investment or financial decisions.
Why Choose Aspira Women's Health Inc. (AWH) Calculator?
- Comprehensive Tool: Offers DCF, WACC, and financial ratio analyses tailored for women's health.
- Customizable Inputs: Modify yellow-highlighted cells to explore different financial scenarios.
- Detailed Insights: Automatically computes Aspira’s intrinsic value and Net Present Value.
- Preloaded Data: Historical and projected data provide reliable starting points for analysis.
- Professional Quality: Perfect for healthcare analysts, investors, and business consultants focused on women's health.
Who Should Use This Product?
- Individual Investors: Make informed decisions about buying or selling Aspira Women's Health Inc. (AWH) stock.
- Financial Analysts: Streamline valuation processes with ready-to-use financial models specific to Aspira Women's Health Inc. (AWH).
- Consultants: Deliver professional valuation insights related to Aspira Women's Health Inc. (AWH) to clients quickly and accurately.
- Business Owners: Understand how companies like Aspira Women's Health Inc. (AWH) are valued to inform your own business strategy.
- Finance Students: Learn valuation techniques using real-world data and scenarios focused on Aspira Women's Health Inc. (AWH).
What the Template Contains
- Pre-Filled Data: Includes Aspira Women's Health Inc.'s (AWH) historical financials and forecasts.
- Discounted Cash Flow Model: Editable DCF valuation model with automatic calculations.
- Weighted Average Cost of Capital (WACC): A dedicated sheet for calculating WACC based on custom inputs.
- Key Financial Ratios: Analyze Aspira Women's Health Inc.'s (AWH) profitability, efficiency, and leverage.
- Customizable Inputs: Edit revenue growth, margins, and tax rates with ease.
- Clear Dashboard: Charts and tables summarizing key valuation results.
Disclaimer
All information, articles, and product details provided on this website are for general informational and educational purposes only. We do not claim any ownership over, nor do we intend to infringe upon, any trademarks, copyrights, logos, brand names, or other intellectual property mentioned or depicted on this site. Such intellectual property remains the property of its respective owners, and any references here are made solely for identification or informational purposes, without implying any affiliation, endorsement, or partnership.
We make no representations or warranties, express or implied, regarding the accuracy, completeness, or suitability of any content or products presented. Nothing on this website should be construed as legal, tax, investment, financial, medical, or other professional advice. In addition, no part of this site—including articles or product references—constitutes a solicitation, recommendation, endorsement, advertisement, or offer to buy or sell any securities, franchises, or other financial instruments, particularly in jurisdictions where such activity would be unlawful.
All content is of a general nature and may not address the specific circumstances of any individual or entity. It is not a substitute for professional advice or services. Any actions you take based on the information provided here are strictly at your own risk. You accept full responsibility for any decisions or outcomes arising from your use of this website and agree to release us from any liability in connection with your use of, or reliance upon, the content or products found herein.