
|
Babcock International Group Plc (BAB.L) Valoración de DCF |
Completamente Editable: Adáptelo A Sus Necesidades En Excel O Sheets
Diseño Profesional: Plantillas Confiables Y Estándares De La Industria
Predeterminadas Para Un Uso Rápido Y Eficiente
Compatible con MAC / PC, completamente desbloqueado
No Se Necesita Experiencia; Fáciles De Seguir
Babcock International Group PLC (BAB.L) Bundle
¡Descubra el verdadero potencial de Babcock International Group PLC (BABL) con nuestra calculadora DCF avanzada! Ajuste los supuestos clave, explore varios escenarios y evalúe cómo los diferentes factores afectan la valoración del grupo internacional de Babcock (BABL), todo dentro de una sola plantilla de Excel.
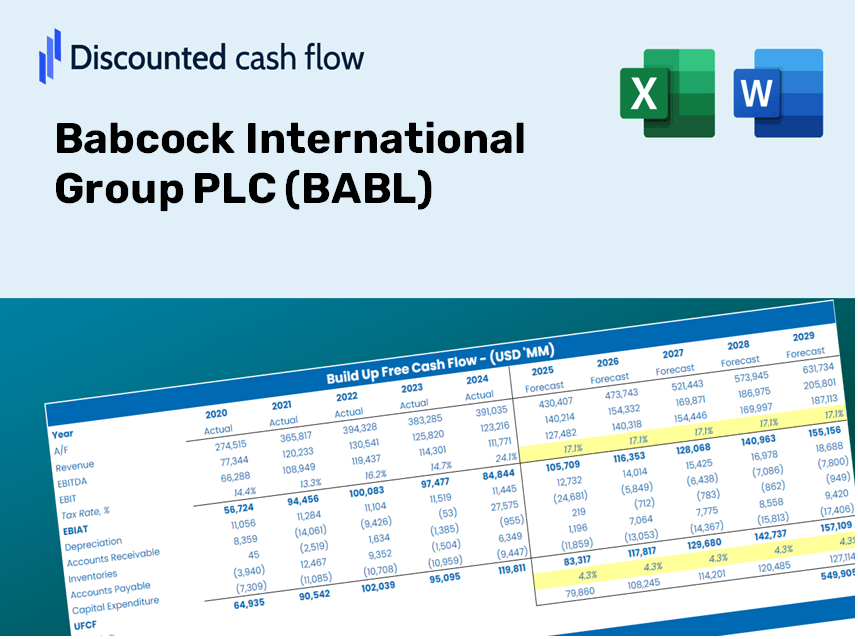
Discounted Cash Flow (DCF) - (USD MM)
| Year | AY1 2021 |
AY2 2022 |
AY3 2023 |
AY4 2024 |
AY5 2025 |
FY1 2026 |
FY2 2027 |
FY3 2028 |
FY4 2029 |
FY5 2030 |
|---|---|---|---|---|---|---|---|---|---|---|
| Revenue | 3,967.1 | 4,096.4 | 4,436.9 | 4,390.1 | 4,831.3 | 5,079.7 | 5,340.9 | 5,615.5 | 5,904.2 | 6,207.8 |
| Revenue Growth, % | 0 | 3.26 | 8.31 | -1.05 | 10.05 | 5.14 | 5.14 | 5.14 | 5.14 | 5.14 |
| EBITDA | -1,440.7 | 439.8 | 249.3 | 381.4 | 498.5 | -9.7 | -10.2 | -10.7 | -11.3 | -11.9 |
| EBITDA, % | -36.32 | 10.74 | 5.62 | 8.69 | 10.32 | -0.19106 | -0.19106 | -0.19106 | -0.19106 | -0.19106 |
| Depreciation | 279.4 | 200.9 | 181.9 | 115.8 | 117.7 | 214.6 | 225.6 | 237.2 | 249.4 | 262.2 |
| Depreciation, % | 7.04 | 4.9 | 4.1 | 2.64 | 2.44 | 4.22 | 4.22 | 4.22 | 4.22 | 4.22 |
| EBIT | -1,720.1 | 238.9 | 67.4 | 265.6 | 380.8 | -224.3 | -235.8 | -247.9 | -260.7 | -274.1 |
| EBIT, % | -43.36 | 5.83 | 1.52 | 6.05 | 7.88 | -4.42 | -4.42 | -4.42 | -4.42 | -4.42 |
| Total Cash | 913.0 | 1,157.7 | 456.0 | 575.0 | 647.8 | 894.6 | 940.6 | 989.0 | 1,039.8 | 1,093.3 |
| Total Cash, percent | .0 | .0 | .0 | .0 | .0 | .0 | .0 | .0 | .0 | .0 |
| Account Receivables | 582.6 | 625.9 | 647.0 | 616.7 | 658.9 | 733.8 | 771.6 | 811.2 | 853.0 | 896.8 |
| Account Receivables, % | 14.69 | 15.28 | 14.58 | 14.05 | 13.64 | 14.45 | 14.45 | 14.45 | 14.45 | 14.45 |
| Inventories | 153.0 | 142.7 | 126.8 | 187.4 | 162.2 | 181.1 | 190.4 | 200.2 | 210.5 | 221.3 |
| Inventories, % | 3.86 | 3.48 | 2.86 | 4.27 | 3.36 | 3.56 | 3.56 | 3.56 | 3.56 | 3.56 |
| Accounts Payable | 410.6 | 164.7 | 239.1 | 314.3 | 229.2 | 321.7 | 338.2 | 355.6 | 373.9 | 393.1 |
| Accounts Payable, % | 10.35 | 4.02 | 5.39 | 7.16 | 4.74 | 6.33 | 6.33 | 6.33 | 6.33 | 6.33 |
| Capital Expenditure | -176.5 | -203.2 | -125.1 | -142.4 | -128.3 | -184.2 | -193.6 | -203.6 | -214.1 | -225.1 |
| Capital Expenditure, % | -4.45 | -4.96 | -2.82 | -3.24 | -2.66 | -3.63 | -3.63 | -3.63 | -3.63 | -3.63 |
| Tax Rate, % | 24.92 | 24.92 | 24.92 | 24.92 | 24.92 | 24.92 | 24.92 | 24.92 | 24.92 | 24.92 |
| EBITAT | -1,725.0 | 241.8 | 761.0 | 203.1 | 285.9 | -202.5 | -213.0 | -223.9 | -235.4 | -247.5 |
| Depreciation | ||||||||||
| Changes in Account Receivables | ||||||||||
| Changes in Inventories | ||||||||||
| Changes in Accounts Payable | ||||||||||
| Capital Expenditure | ||||||||||
| UFCF | -1,947.1 | -39.4 | 887.0 | 221.4 | 173.2 | -173.5 | -211.5 | -222.4 | -233.8 | -245.8 |
| WACC, % | 7.5 | 7.5 | 7.5 | 7.31 | 7.3 | 7.42 | 7.42 | 7.42 | 7.42 | 7.42 |
| PV UFCF | ||||||||||
| SUM PV UFCF | -871.6 | |||||||||
| Long Term Growth Rate, % | 3.00 | |||||||||
| Free cash flow (T + 1) | -253 | |||||||||
| Terminal Value | -5,726 | |||||||||
| Present Terminal Value | -4,003 | |||||||||
| Enterprise Value | -4,875 | |||||||||
| Net Debt | 379 | |||||||||
| Equity Value | -5,254 | |||||||||
| Diluted Shares Outstanding, MM | 514 | |||||||||
| Equity Value Per Share | -1,021.42 |
Your Benefits
- Flexible Forecast Inputs: Effortlessly adjust assumptions (growth %, margins, WACC) to model various scenarios.
- Comprehensive Data: Babcock International Group PLC’s financials are pre-loaded to facilitate your analysis.
- Automated DCF Calculations: The template computes Net Present Value (NPV) and intrinsic value automatically.
- Customizable and Professional Design: A sleek Excel model tailored to meet your valuation requirements.
- Designed for Analysts and Investors: Perfect for evaluating projections, confirming strategies, and enhancing efficiency.
Key Features
- Comprehensive BABL Data: Includes detailed historical financials and forward-looking estimates for Babcock International Group PLC.
- Customizable Variables: Tailor inputs for revenue growth, profit margins, WACC, tax rates, and capital expenditures.
- Interactive Valuation Model: Automatically refreshes Net Present Value (NPV) and intrinsic value based on your adjustments.
- Scenario Analysis: Generate multiple forecasting scenarios to explore various valuation possibilities.
- User-Centric Interface: Intuitive layout designed for both seasoned professionals and newcomers.
How It Works
- Download the Template: Get immediate access to the Excel-based BABL DCF Calculator.
- Input Your Assumptions: Modify the yellow-highlighted cells for growth rates, WACC, profit margins, and more.
- Instant Calculations: The model automatically recalculates Babcock International Group's intrinsic value.
- Test Scenarios: Experiment with different assumptions to assess potential changes in valuation.
- Analyze and Decide: Utilize the results to inform your investment or financial evaluations.
Why Choose This Calculator for Babcock International Group PLC (BABL)?
- Precision: Utilizes accurate financial data from Babcock International for reliable results.
- Versatility: Tailored to allow users to easily adjust and evaluate various inputs.
- Efficiency: Eliminate the tedious process of creating a DCF model from the ground up.
- High-Quality: Crafted with a focus on precision and usability, suitable for CFO-level analysis.
- Intuitive: Simple to navigate, even for individuals without extensive financial modeling expertise.
Who Can Benefit from Babcock International Group PLC (BABL)?
- Investors: Gain confidence in your investment choices with our advanced valuation tool.
- Financial Analysts: Streamline your workflow with a fully customizable DCF model at your fingertips.
- Consultants: Effortlessly modify the template for impactful client presentations or detailed reports.
- Finance Enthusiasts: Enhance your grasp of valuation methods with practical, real-world scenarios.
- Educators and Students: Utilize this resource as an effective learning aid in finance studies.
What the Template Contains
- Historical Data: Comprehensive overview of Babcock International Group PLC's (BABL) previous financial performance and foundational forecasts.
- DCF and Levered DCF Models: In-depth templates designed to assess the intrinsic value of Babcock International Group PLC (BABL).
- WACC Sheet: Ready-to-use calculations for the Weighted Average Cost of Capital specific to Babcock International Group PLC (BABL).
- Editable Inputs: Tailor key variables such as growth rates, EBITDA %, and CAPEX estimates for Babcock International Group PLC (BABL).
- Quarterly and Annual Statements: An exhaustive analysis of Babcock International Group PLC's (BABL) financials.
- Interactive Dashboard: Dynamically visualize valuation outcomes and future projections for Babcock International Group PLC (BABL).
Disclaimer
All information, articles, and product details provided on this website are for general informational and educational purposes only. We do not claim any ownership over, nor do we intend to infringe upon, any trademarks, copyrights, logos, brand names, or other intellectual property mentioned or depicted on this site. Such intellectual property remains the property of its respective owners, and any references here are made solely for identification or informational purposes, without implying any affiliation, endorsement, or partnership.
We make no representations or warranties, express or implied, regarding the accuracy, completeness, or suitability of any content or products presented. Nothing on this website should be construed as legal, tax, investment, financial, medical, or other professional advice. In addition, no part of this site—including articles or product references—constitutes a solicitation, recommendation, endorsement, advertisement, or offer to buy or sell any securities, franchises, or other financial instruments, particularly in jurisdictions where such activity would be unlawful.
All content is of a general nature and may not address the specific circumstances of any individual or entity. It is not a substitute for professional advice or services. Any actions you take based on the information provided here are strictly at your own risk. You accept full responsibility for any decisions or outcomes arising from your use of this website and agree to release us from any liability in connection with your use of, or reliance upon, the content or products found herein.