
|
A.G. Barr P.L.C. (Bag.L) Valoración de DCF |
Completamente Editable: Adáptelo A Sus Necesidades En Excel O Sheets
Diseño Profesional: Plantillas Confiables Y Estándares De La Industria
Predeterminadas Para Un Uso Rápido Y Eficiente
Compatible con MAC / PC, completamente desbloqueado
No Se Necesita Experiencia; Fáciles De Seguir
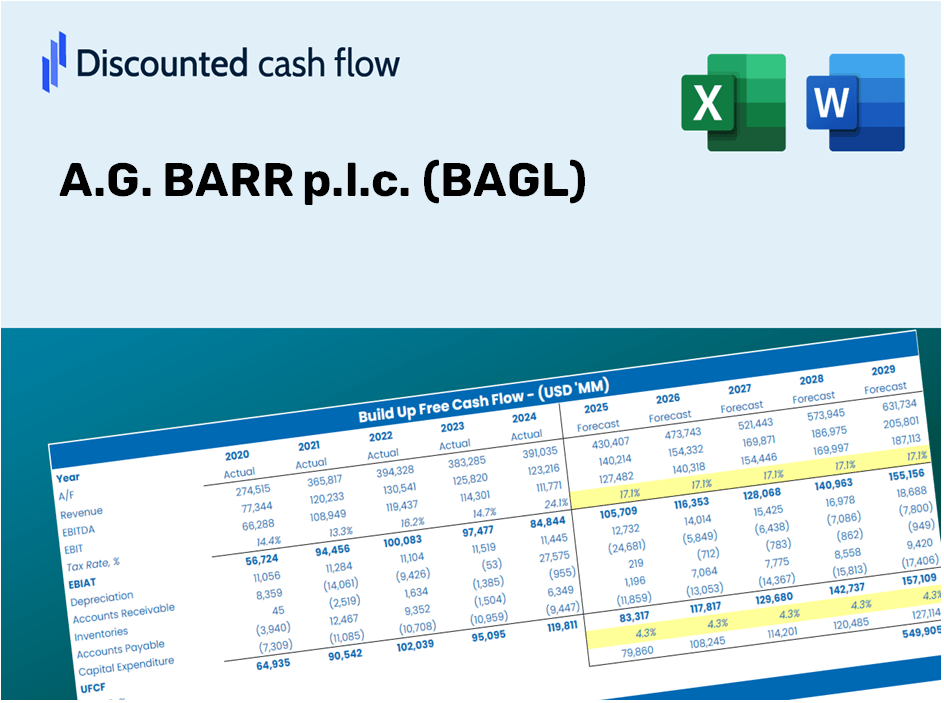
A.G. BARR p.l.c. (BAG.L) Bundle
Evaluar A.G. Barr P.L.C. ¡Las perspectivas financieras como un experto! Esta calculadora DCF (BAGL) le proporciona datos financieros previamente llenos y le permite modificar fácilmente el crecimiento de los ingresos, WACC, los márgenes y otros supuestos cruciales para alinearse con sus pronósticos.
Discounted Cash Flow (DCF) - (USD MM)
| Year | AY1 2021 |
AY2 2022 |
AY3 2023 |
AY4 2024 |
AY5 2025 |
FY1 2026 |
FY2 2027 |
FY3 2028 |
FY4 2029 |
FY5 2030 |
|---|---|---|---|---|---|---|---|---|---|---|
| Revenue | 227.0 | 268.6 | 317.6 | 400.0 | 420.4 | 491.5 | 574.5 | 671.7 | 785.2 | 917.9 |
| Revenue Growth, % | 0 | 18.33 | 18.24 | 25.94 | 5.1 | 16.9 | 16.9 | 16.9 | 16.9 | 16.9 |
| EBITDA | 39.5 | 53.8 | 55.7 | 63.8 | 65.9 | 85.1 | 99.5 | 116.3 | 136.0 | 159.0 |
| EBITDA, % | 17.4 | 20.03 | 17.54 | 15.95 | 15.68 | 17.32 | 17.32 | 17.32 | 17.32 | 17.32 |
| Depreciation | 12.9 | 11.2 | 11.0 | 12.3 | 12.2 | 19.0 | 22.2 | 25.9 | 30.3 | 35.4 |
| Depreciation, % | 5.68 | 4.17 | 3.46 | 3.08 | 2.9 | 3.86 | 3.86 | 3.86 | 3.86 | 3.86 |
| EBIT | 26.6 | 42.6 | 44.7 | 51.5 | 53.7 | 66.2 | 77.3 | 90.4 | 105.7 | 123.6 |
| EBIT, % | 11.72 | 15.86 | 14.07 | 12.88 | 12.77 | 13.46 | 13.46 | 13.46 | 13.46 | 13.46 |
| Total Cash | 52.9 | 68.7 | 53.6 | 53.6 | 64.8 | 93.0 | 108.7 | 127.0 | 148.5 | 173.6 |
| Total Cash, percent | .0 | .0 | .0 | .0 | .0 | .0 | .0 | .0 | .0 | .0 |
| Account Receivables | 36.3 | 41.6 | 55.8 | 59.8 | 73.3 | 80.0 | 93.6 | 109.4 | 127.9 | 149.5 |
| Account Receivables, % | 15.99 | 15.49 | 17.57 | 14.95 | 17.44 | 16.29 | 16.29 | 16.29 | 16.29 | 16.29 |
| Inventories | 19.3 | 24.2 | 34.7 | 36.5 | 31.7 | 44.3 | 51.8 | 60.6 | 70.8 | 82.8 |
| Inventories, % | 8.5 | 9.01 | 10.93 | 9.13 | 7.54 | 9.02 | 9.02 | 9.02 | 9.02 | 9.02 |
| Accounts Payable | 7.3 | 15.8 | 37.2 | 36.1 | 32.4 | 36.9 | 43.1 | 50.4 | 59.0 | 68.9 |
| Accounts Payable, % | 3.22 | 5.88 | 11.71 | 9.03 | 7.71 | 7.51 | 7.51 | 7.51 | 7.51 | 7.51 |
| Capital Expenditure | -7.1 | -5.0 | -14.6 | -17.8 | -19.2 | -18.3 | -21.4 | -25.0 | -29.2 | -34.2 |
| Capital Expenditure, % | -3.13 | -1.86 | -4.6 | -4.45 | -4.57 | -3.72 | -3.72 | -3.72 | -3.72 | -3.72 |
| Tax Rate, % | 25.38 | 25.38 | 25.38 | 25.38 | 25.38 | 25.38 | 25.38 | 25.38 | 25.38 | 25.38 |
| EBITAT | 19.5 | 28.1 | 34.1 | 38.7 | 40.1 | 48.3 | 56.5 | 66.1 | 77.2 | 90.3 |
| Depreciation | ||||||||||
| Changes in Account Receivables | ||||||||||
| Changes in Inventories | ||||||||||
| Changes in Accounts Payable | ||||||||||
| Capital Expenditure | ||||||||||
| UFCF | -23.0 | 32.6 | 27.2 | 26.3 | 20.7 | 34.1 | 42.5 | 49.7 | 58.1 | 67.9 |
| WACC, % | 5.5 | 5.49 | 5.5 | 5.5 | 5.5 | 5.5 | 5.5 | 5.5 | 5.5 | 5.5 |
| PV UFCF | ||||||||||
| SUM PV UFCF | 211.8 | |||||||||
| Long Term Growth Rate, % | 2.00 | |||||||||
| Free cash flow (T + 1) | 69 | |||||||||
| Terminal Value | 1,981 | |||||||||
| Present Terminal Value | 1,516 | |||||||||
| Enterprise Value | 1,728 | |||||||||
| Net Debt | -17 | |||||||||
| Equity Value | 1,745 | |||||||||
| Diluted Shares Outstanding, MM | 112 | |||||||||
| Equity Value Per Share | 1,557.00 |
What You Will Receive
- Authentic A.G. BARR Data: Pre-loaded financial information – from revenue to EBIT – based on actual and forecasted figures.
- Comprehensive Customization: Modify all key parameters (yellow cells) such as WACC, growth %, and tax rates.
- Real-Time Valuation Updates: Automatic recalculations to evaluate the effects of adjustments on A.G. BARR’s fair value.
- Flexible Excel Template: Designed for quick modifications, scenario analysis, and in-depth projections.
- Efficient and Precise: Eliminate the need to build models from the ground up while ensuring accuracy and adaptability.
Key Features
- 🔍 Real-Life BAGL Financials: Pre-filled historical and projected data for A.G. BARR p.l.c.
- ✏️ Fully Customizable Inputs: Modify all essential parameters (yellow cells) such as WACC, growth %, and tax rates.
- 📊 Professional DCF Valuation: Integrated formulas compute A.G. BARR's intrinsic value using the Discounted Cash Flow method.
- ⚡ Instant Results: See A.G. BARR's valuation immediately after adjustments are made.
- Scenario Analysis: Analyze and compare various financial assumptions side-by-side.
How It Works
- Download: Obtain the pre-formatted Excel file containing A.G. BARR p.l.c. (BAGL) financial data.
- Customize: Modify projections, including sales growth, EBITDA percentage, and weighted average cost of capital (WACC).
- Update Automatically: Watch as intrinsic value and net present value (NPV) calculations refresh in real-time.
- Test Scenarios: Generate various forecasts and instantly compare the results.
- Make Decisions: Leverage the valuation insights to inform your investment choices.
Why Choose This Calculator for A.G. BARR p.l.c. (BAGL)?
- User-Friendly Interface: Tailored for both novices and seasoned users.
- Customizable Inputs: Effortlessly adjust parameters to suit your analysis needs.
- Real-Time Updates: Observe immediate changes in A.G. BARR's valuation as you modify inputs.
- Preloaded Data: Comes equipped with A.G. BARR's actual financial metrics for swift evaluation.
- Industry Trusted: Valued by investors and analysts for informed decision-making.
Who Should Consider A.G. BARR p.l.c. (BAGL)?
- Individual Investors: Make educated decisions regarding the purchase or sale of A.G. BARR p.l.c. (BAGL) shares.
- Financial Analysts: Enhance valuation workflows with comprehensive financial models tailored for A.G. BARR p.l.c. (BAGL).
- Consultants: Provide clients with swift and precise valuation insights related to A.G. BARR p.l.c. (BAGL).
- Business Owners: Gain insights into how companies like A.G. BARR p.l.c. (BAGL) are valued to inform your own business strategies.
- Finance Students: Explore valuation methodologies using real-world data from A.G. BARR p.l.c. (BAGL) and similar cases.
Contents of the Template
- Pre-Filled Data: Contains historical financials and projections for A.G. BARR p.l.c. (BAGL).
- Discounted Cash Flow Model: An editable DCF valuation model featuring automatic calculations.
- Weighted Average Cost of Capital (WACC): A dedicated worksheet for calculating WACC with user-defined inputs.
- Key Financial Ratios: Evaluate A.G. BARR's profitability, efficiency, and leverage metrics.
- Customizable Inputs: Easily adjust revenue growth, profit margins, and tax rates.
- User-Friendly Dashboard: Visual charts and tables showcasing essential valuation outcomes.
Disclaimer
All information, articles, and product details provided on this website are for general informational and educational purposes only. We do not claim any ownership over, nor do we intend to infringe upon, any trademarks, copyrights, logos, brand names, or other intellectual property mentioned or depicted on this site. Such intellectual property remains the property of its respective owners, and any references here are made solely for identification or informational purposes, without implying any affiliation, endorsement, or partnership.
We make no representations or warranties, express or implied, regarding the accuracy, completeness, or suitability of any content or products presented. Nothing on this website should be construed as legal, tax, investment, financial, medical, or other professional advice. In addition, no part of this site—including articles or product references—constitutes a solicitation, recommendation, endorsement, advertisement, or offer to buy or sell any securities, franchises, or other financial instruments, particularly in jurisdictions where such activity would be unlawful.
All content is of a general nature and may not address the specific circumstances of any individual or entity. It is not a substitute for professional advice or services. Any actions you take based on the information provided here are strictly at your own risk. You accept full responsibility for any decisions or outcomes arising from your use of this website and agree to release us from any liability in connection with your use of, or reliance upon, the content or products found herein.