
|
Bajaj Finserv Ltd. (Bajajfinsv.ns) DCF Valoración |
Completamente Editable: Adáptelo A Sus Necesidades En Excel O Sheets
Diseño Profesional: Plantillas Confiables Y Estándares De La Industria
Predeterminadas Para Un Uso Rápido Y Eficiente
Compatible con MAC / PC, completamente desbloqueado
No Se Necesita Experiencia; Fáciles De Seguir
Bajaj Finserv Ltd. (BAJAJFINSV.NS) Bundle
¡Descubra el verdadero potencial de Bajaj Finserv Ltd. con nuestra calculadora DCF avanzada! Ajuste los supuestos clave, explore varios escenarios y evalúe cómo influyen los diferentes factores Bajaj Finserv Ltd. Valoración: todo dentro de una sola plantilla de Excel.
Benefits You Will Receive
- Customizable Excel Template: An adaptable Excel-based DCF Calculator featuring pre-populated financial data for Bajaj Finserv Ltd. (BAJAJFINSVNS).
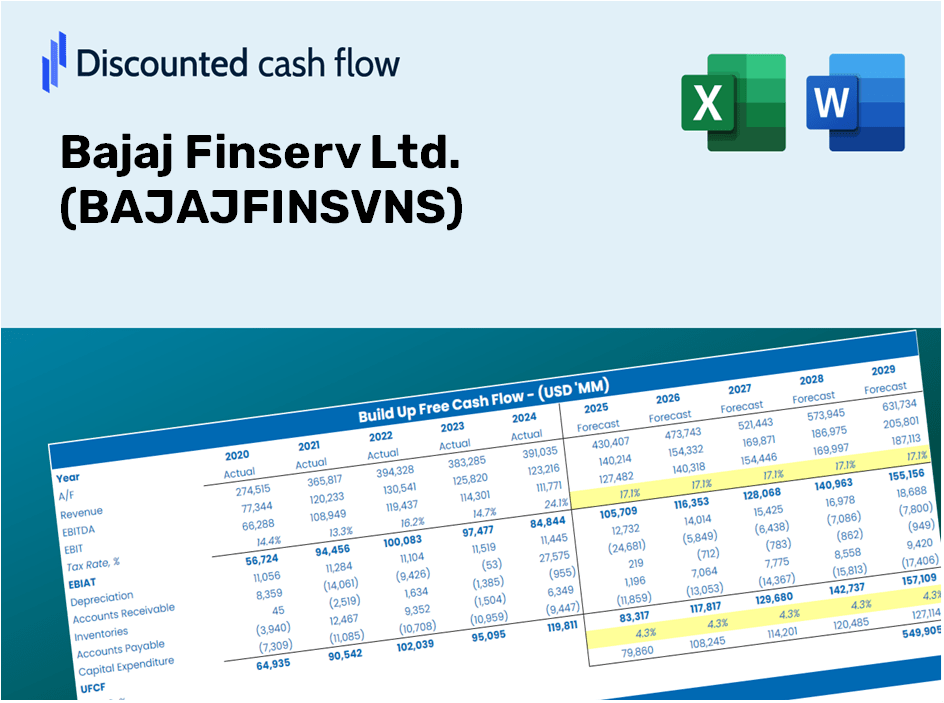
- Actual Data Insights: Access to historical performance and forward-looking estimates (highlighted in the yellow cells).
- Assumption Adjustability: Modify forecast parameters such as revenue growth, EBITDA margin, and WACC as needed.
- Instant Calculations: Quickly observe how your inputs affect the valuation of Bajaj Finserv Ltd. (BAJAJFINSVNS).
- Professional-Grade Tool: Designed for the use of investors, CFOs, consultants, and financial analysts.
- User-Centric Design: Organized for easy navigation and understanding, along with comprehensive step-by-step guidance.
Key Features
- Comprehensive Data: Bajaj Finserv Ltd.'s (BAJAJFINSVNS) historical financial records and pre-populated forecasts.
- Customizable Inputs: Modify WACC, tax rates, revenue growth, and EBITDA margins as needed.
- Real-Time Insights: Instantly view Bajaj Finserv Ltd.'s (BAJAJFINSVNS) intrinsic value recalculating dynamically.
- Engaging Visualizations: Dashboard graphics showcase valuation results and essential metrics.
- Designed for Precision: A robust tool tailored for analysts, investors, and financial professionals.
How It Works
- Step 1: Download the Excel file.
- Step 2: Review the pre-filled Bajaj Finserv Ltd. (BAJAJFINSVNS) data (historical and projected).
- Step 3: Modify key assumptions (highlighted in yellow) based on your analysis.
- Step 4: Observe the automatic recalculations for Bajaj Finserv Ltd.'s intrinsic value.
- Step 5: Utilize the results for investment decisions or reporting purposes.
Why Select This Calculator?
- User-Friendly and Intuitive: Perfect for both newcomers and seasoned professionals.
- Customizable Assumptions: Easily adjust inputs to fit your analysis needs.
- Real-Time Updates: Observe immediate changes to Bajaj Finserv Ltd.'s valuation as you modify inputs.
- Pre-Configured: Comes preloaded with Bajaj Finserv Ltd.'s actual financial data for swift analysis.
- Relied Upon by Experts: Widely utilized by investors and analysts for informed decision-making.
Who is This Product Designed For?
- Finance Students: Understand valuation methods and practice using real-world data.
- Academics: Integrate industry-standard models into your lectures or research projects.
- Investors: Validate your hypotheses and evaluate the valuation performance of Bajaj Finserv Ltd. (BAJAJFINSVNS).
- Analysts: Enhance efficiency with a ready-to-use, customizable DCF model.
- Small Business Owners: Discover how major public entities like Bajaj Finserv Ltd. (BAJAJFINSVNS) are appraised.
Contents of the Template
- Comprehensive DCF Model: Editable template featuring extensive valuation calculations.
- Real-World Data: Bajaj Finserv Ltd.’s (BAJAJFINSVNS) historical and projected financials preloaded for thorough analysis.
- Customizable Parameters: Modify WACC, growth rates, and tax assumptions to explore various scenarios.
- Financial Statements: Complete annual and quarterly breakdowns for enhanced insights.
- Key Ratios: Integrated analysis for profitability, efficiency, and leverage metrics.
- Dashboard with Visual Outputs: Charts and tables for straightforward, actionable results.
Disclaimer
All information, articles, and product details provided on this website are for general informational and educational purposes only. We do not claim any ownership over, nor do we intend to infringe upon, any trademarks, copyrights, logos, brand names, or other intellectual property mentioned or depicted on this site. Such intellectual property remains the property of its respective owners, and any references here are made solely for identification or informational purposes, without implying any affiliation, endorsement, or partnership.
We make no representations or warranties, express or implied, regarding the accuracy, completeness, or suitability of any content or products presented. Nothing on this website should be construed as legal, tax, investment, financial, medical, or other professional advice. In addition, no part of this site—including articles or product references—constitutes a solicitation, recommendation, endorsement, advertisement, or offer to buy or sell any securities, franchises, or other financial instruments, particularly in jurisdictions where such activity would be unlawful.
All content is of a general nature and may not address the specific circumstances of any individual or entity. It is not a substitute for professional advice or services. Any actions you take based on the information provided here are strictly at your own risk. You accept full responsibility for any decisions or outcomes arising from your use of this website and agree to release us from any liability in connection with your use of, or reliance upon, the content or products found herein.