
|
Valoración de DCF de TRITAX Big Box REIT PLC (BBOX.L) |
Completamente Editable: Adáptelo A Sus Necesidades En Excel O Sheets
Diseño Profesional: Plantillas Confiables Y Estándares De La Industria
Predeterminadas Para Un Uso Rápido Y Eficiente
Compatible con MAC / PC, completamente desbloqueado
No Se Necesita Experiencia; Fáciles De Seguir
Tritax Big Box REIT plc (BBOX.L) Bundle
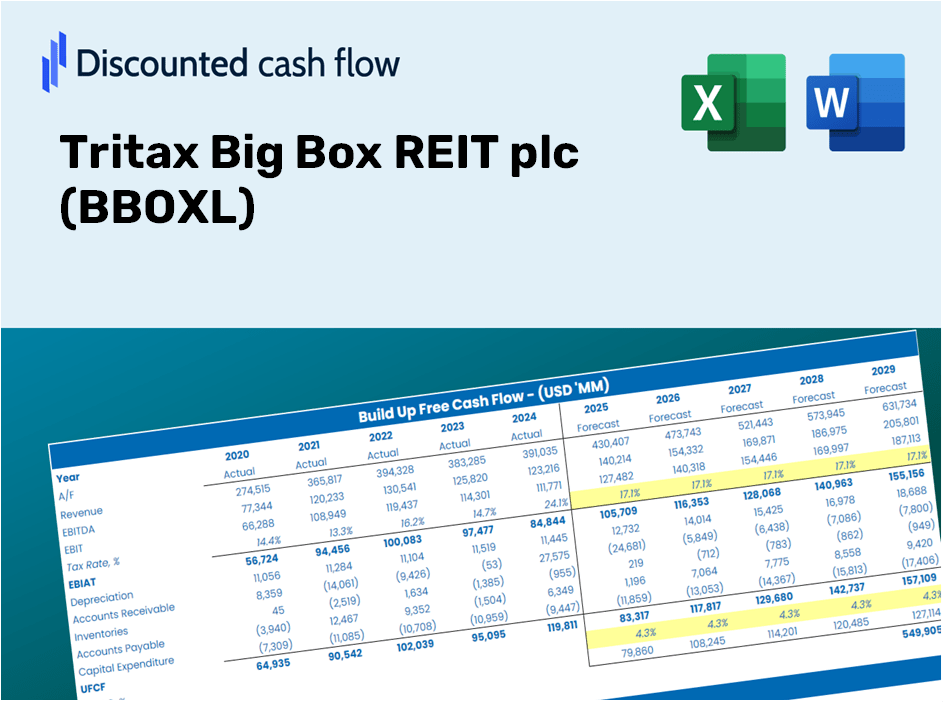
Valoración de Strewline TRITAX Big Box REIT PLC (BBOXL) con nuestra calculadora DCF personalizable. Con las finanzas Real TRITAX Big Box REIT PLC (BBOXL) y las entradas de pronóstico ajustables, puede explorar diferentes escenarios y determinar el valor razonable TRITAX Big Box Reit PLC (BBOXL) en solo minutos.
What You Will Receive
- Authentic Tritax Data: Preloaded financial metrics – from revenue to net operating income – based on historical and projected figures.
- Comprehensive Customization: Modify all essential parameters (highlighted cells) such as discount rates, growth percentages, and tax rates.
- Immediate Valuation Updates: Automatic recalculations to assess the effect of changes on the fair value of Tritax Big Box REIT plc (BBOXL).
- User-Friendly Excel Template: Designed for quick adjustments, scenario analysis, and in-depth projections.
- Efficient and Precise: Avoid constructing models from the ground up while ensuring accuracy and adaptability.
Key Features
- Actual Tritax Big Box Financials: Gain access to reliable pre-loaded historical data and forward-looking projections.
- Adjustable Forecast Assumptions: Modify highlighted cells for parameters like WACC, growth rates, and profit margins.
- Real-Time Calculations: Automatic updates to DCF, Net Present Value (NPV), and cash flow analysis.
- User-Friendly Dashboard: Clear charts and summaries to effectively visualize your valuation outcomes.
- Suitable for All Levels: An intuitive layout designed for investors, CFOs, and consultants alike.
How It Operates
- Download: Obtain the pre-formatted Excel file featuring Tritax Big Box REIT plc's (BBOXL) financial information.
- Customize: Modify projections, including rental income growth, operating profit margins, and discount rates.
- Update Automatically: The intrinsic value and NPV calculations refresh in real-time.
- Test Scenarios: Develop various forecasts and instantly analyze the results.
- Make Decisions: Leverage the valuation insights to inform your investment strategy.
Reasons to Choose the Tritax Big Box REIT plc (BBOXL) Calculator
- Precision: Utilizes authentic Tritax Big Box financial data for reliable results.
- Versatility: Built for users to easily experiment with and adjust inputs.
- Efficiency: Eliminate the need to construct a DCF model from the ground up.
- Expert-Level: Crafted with the attention to detail expected from CFOs.
- Accessible: Intuitive design makes it straightforward for users of all skill levels.
Who Can Benefit from This Product?
- Investors: Evaluate Tritax Big Box REIT plc’s (BBOXL) valuation before making buying or selling decisions.
- CFOs and Financial Analysts: Enhance valuation workflows and validate financial projections.
- Real Estate Professionals: Understand the valuation methods used for major real estate investment trusts like Tritax Big Box REIT plc.
- Consultants: Create detailed valuation reports for clients in the real estate sector.
- Students and Educators: Utilize actual market data to practice and teach valuation methodologies.
Contents of the Template
- Pre-Filled DCF Model: Tritax Big Box REIT plc’s financial data ready for immediate analysis.
- WACC Calculator: Comprehensive calculations for the Weighted Average Cost of Capital.
- Financial Ratios: Assess Tritax's profitability, leverage, and operational efficiency.
- Editable Inputs: Modify variables such as growth rates, profit margins, and CAPEX to suit your analysis.
- Financial Statements: Annual and quarterly reports available for in-depth examination.
- Interactive Dashboard: Effortlessly visualize essential valuation metrics and outcomes.
Disclaimer
All information, articles, and product details provided on this website are for general informational and educational purposes only. We do not claim any ownership over, nor do we intend to infringe upon, any trademarks, copyrights, logos, brand names, or other intellectual property mentioned or depicted on this site. Such intellectual property remains the property of its respective owners, and any references here are made solely for identification or informational purposes, without implying any affiliation, endorsement, or partnership.
We make no representations or warranties, express or implied, regarding the accuracy, completeness, or suitability of any content or products presented. Nothing on this website should be construed as legal, tax, investment, financial, medical, or other professional advice. In addition, no part of this site—including articles or product references—constitutes a solicitation, recommendation, endorsement, advertisement, or offer to buy or sell any securities, franchises, or other financial instruments, particularly in jurisdictions where such activity would be unlawful.
All content is of a general nature and may not address the specific circumstances of any individual or entity. It is not a substitute for professional advice or services. Any actions you take based on the information provided here are strictly at your own risk. You accept full responsibility for any decisions or outcomes arising from your use of this website and agree to release us from any liability in connection with your use of, or reliance upon, the content or products found herein.