
|
Valoración DCF de Bath & Body Works, Inc. (BBWI) |
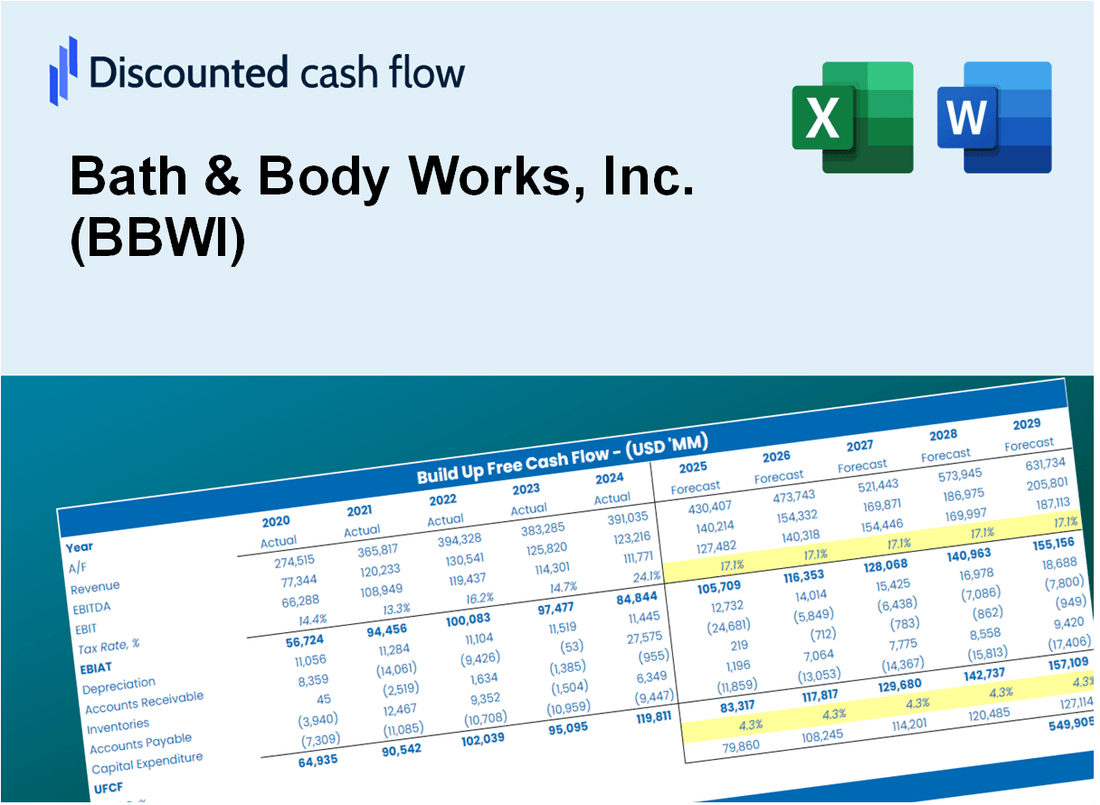
Completamente Editable: Adáptelo A Sus Necesidades En Excel O Sheets
Diseño Profesional: Plantillas Confiables Y Estándares De La Industria
Predeterminadas Para Un Uso Rápido Y Eficiente
Compatible con MAC / PC, completamente desbloqueado
No Se Necesita Experiencia; Fáciles De Seguir
Bath & Body Works, Inc. (BBWI) Bundle
Explorar Baño & ¡Body Works, Inc. (BBWI) Perspectivas financieras con nuestra calculadora DCF fácil de usar! Ingrese sus proyecciones para el crecimiento, los márgenes y los gastos para calcular el valor intrínseco del baño & Body Works, Inc. (BBWI) y mejora su estrategia de inversión.
What You Will Get
- Editable Forecast Inputs: Easily modify key assumptions (growth %, margins, WACC) to develop various scenarios.
- Real-World Data: Bath & Body Works, Inc. (BBWI) financial information pre-filled to kickstart your analysis.
- Automatic DCF Outputs: The template computes Net Present Value (NPV) and intrinsic value automatically for you.
- Customizable and Professional: A refined Excel model designed to meet your valuation requirements.
- Built for Analysts and Investors: Perfect for evaluating projections, confirming strategies, and enhancing efficiency.
Key Features
- Real-Life BBWI Data: Pre-filled with Bath & Body Works' historical financials and forward-looking projections.
- Fully Customizable Inputs: Adjust revenue growth, margins, WACC, tax rates, and capital expenditures.
- Dynamic Valuation Model: Automatic updates to Net Present Value (NPV) and intrinsic value based on your inputs.
- Scenario Testing: Create multiple forecast scenarios to analyze different valuation outcomes.
- User-Friendly Design: Simple, structured, and designed for professionals and beginners alike.
How It Works
- Download the Template: Gain immediate access to the Excel-based BBWI DCF Calculator.
- Input Your Assumptions: Modify the yellow-highlighted cells for growth rates, WACC, margins, and other variables.
- Instant Calculations: The model automatically recalculates Bath & Body Works’ intrinsic value.
- Test Scenarios: Experiment with different assumptions to assess potential valuation changes.
- Analyze and Decide: Leverage the results to inform your investment or financial analysis.
Why Choose This Calculator for Bath & Body Works, Inc. (BBWI)?
- User-Friendly Interface: Tailored for both novices and seasoned professionals.
- Customizable Inputs: Adjust parameters effortlessly to suit your analysis needs.
- Real-Time Feedback: Observe immediate updates to Bath & Body Works' valuation as you tweak inputs.
- Pre-Loaded Data: Comes with Bath & Body Works' actual financial metrics for rapid evaluation.
- Widely Endorsed: Favored by investors and analysts for making well-informed choices.
Who Should Use This Product?
- Individual Investors: Gain insights to make informed decisions about buying or selling Bath & Body Works stock (BBWI).
- Financial Analysts: Enhance valuation processes with ready-to-use financial models tailored for Bath & Body Works (BBWI).
- Consultants: Provide clients with accurate and timely valuation insights related to Bath & Body Works (BBWI).
- Business Owners: Learn about the valuation strategies of successful companies like Bath & Body Works (BBWI) to inform your own business decisions.
- Finance Students: Explore valuation techniques through real-world data and case studies involving Bath & Body Works (BBWI).
What the Template Contains
- Pre-Filled Data: Includes Bath & Body Works' historical financials and projections.
- Discounted Cash Flow Model: Editable DCF valuation model with automatic calculations.
- Weighted Average Cost of Capital (WACC): A dedicated sheet for calculating WACC based on custom inputs.
- Key Financial Ratios: Analyze Bath & Body Works' profitability, efficiency, and leverage.
- Customizable Inputs: Edit revenue growth, margins, and tax rates with ease.
- Clear Dashboard: Charts and tables summarizing key valuation results.
Disclaimer
All information, articles, and product details provided on this website are for general informational and educational purposes only. We do not claim any ownership over, nor do we intend to infringe upon, any trademarks, copyrights, logos, brand names, or other intellectual property mentioned or depicted on this site. Such intellectual property remains the property of its respective owners, and any references here are made solely for identification or informational purposes, without implying any affiliation, endorsement, or partnership.
We make no representations or warranties, express or implied, regarding the accuracy, completeness, or suitability of any content or products presented. Nothing on this website should be construed as legal, tax, investment, financial, medical, or other professional advice. In addition, no part of this site—including articles or product references—constitutes a solicitation, recommendation, endorsement, advertisement, or offer to buy or sell any securities, franchises, or other financial instruments, particularly in jurisdictions where such activity would be unlawful.
All content is of a general nature and may not address the specific circumstances of any individual or entity. It is not a substitute for professional advice or services. Any actions you take based on the information provided here are strictly at your own risk. You accept full responsibility for any decisions or outcomes arising from your use of this website and agree to release us from any liability in connection with your use of, or reliance upon, the content or products found herein.