
|
Samsung Electronics Co., Ltd. (BC94.L) Valoración de DCF |
Completamente Editable: Adáptelo A Sus Necesidades En Excel O Sheets
Diseño Profesional: Plantillas Confiables Y Estándares De La Industria
Predeterminadas Para Un Uso Rápido Y Eficiente
Compatible con MAC / PC, completamente desbloqueado
No Se Necesita Experiencia; Fáciles De Seguir
Samsung Electronics Co., Ltd. (BC94.L) Bundle
Diseñada para la precisión, nuestra calculadora DCF (BC94L) le permite evaluar Samsung Electronics Co., Ltd. Valoración utilizando datos financieros en tiempo real y la capacidad completa de modificar todos los parámetros esenciales para pronósticos mejorados.
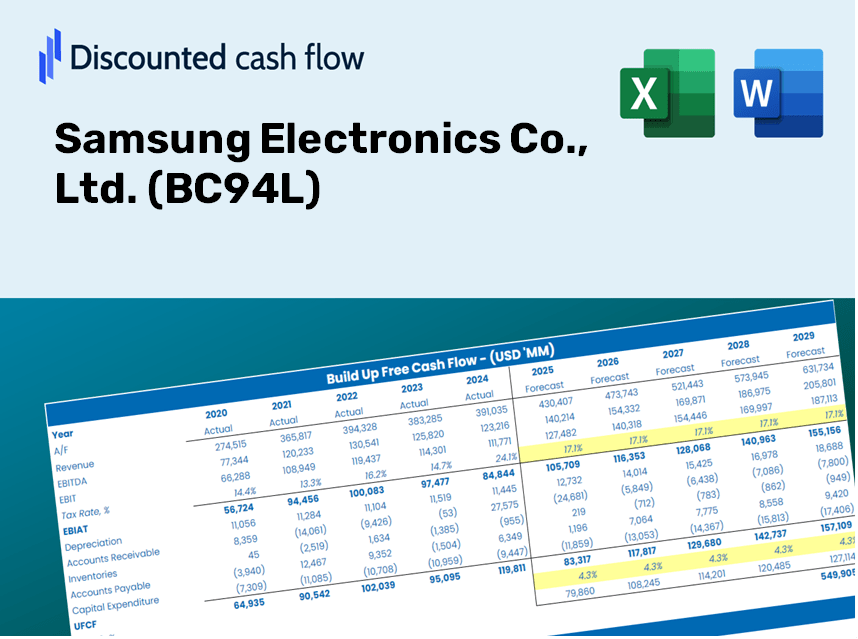
Discounted Cash Flow (DCF) - (USD MM)
| Year | AY1 2020 |
AY2 2021 |
AY3 2022 |
AY4 2023 |
AY5 2024 |
FY1 2025 |
FY2 2026 |
FY3 2027 |
FY4 2028 |
FY5 2029 |
|---|---|---|---|---|---|---|---|---|---|---|
| Revenue | 162,919.7 | 192,363.9 | 207,930.7 | 178,143.7 | 206,994.7 | 221,502.5 | 237,027.1 | 253,639.8 | 271,416.8 | 290,439.8 |
| Revenue Growth, % | 0 | 18.07 | 8.09 | -14.33 | 16.2 | 7.01 | 7.01 | 7.01 | 7.01 | 7.01 |
| EBITDA | 45,928.0 | 60,061.9 | 58,630.4 | 34,203.5 | 55,254.4 | 59,143.1 | 63,288.3 | 67,724.0 | 72,470.6 | 77,549.9 |
| EBITDA, % | 28.19 | 31.22 | 28.2 | 19.2 | 26.69 | 26.7 | 26.7 | 26.7 | 26.7 | 26.7 |
| Depreciation | 20,870.4 | 23,561.7 | 26,905.5 | 26,602.0 | 29,329.4 | 29,725.8 | 31,809.2 | 34,038.7 | 36,424.4 | 38,977.3 |
| Depreciation, % | 12.81 | 12.25 | 12.94 | 14.93 | 14.17 | 13.42 | 13.42 | 13.42 | 13.42 | 13.42 |
| EBIT | 25,057.5 | 36,500.2 | 31,724.9 | 7,601.5 | 25,925.1 | 29,417.3 | 31,479.0 | 33,685.3 | 36,046.3 | 38,572.7 |
| EBIT, % | 15.38 | 18.97 | 15.26 | 4.27 | 12.52 | 13.28 | 13.28 | 13.28 | 13.28 | 13.28 |
| Total Cash | 85,759.3 | 85,413.5 | 79,274.6 | 63,574.8 | 77,502.7 | 92,276.1 | 98,743.5 | 105,664.2 | 113,070.0 | 120,994.8 |
| Total Cash, percent | .0 | .0 | .0 | .0 | .0 | .0 | .0 | .0 | .0 | .0 |
| Account Receivables | 23,783.4 | 31,104.3 | 28,806.5 | 29,776.4 | 36,632.5 | 35,012.3 | 37,466.3 | 40,092.2 | 42,902.2 | 45,909.1 |
| Account Receivables, % | 14.6 | 16.17 | 13.85 | 16.71 | 17.7 | 15.81 | 15.81 | 15.81 | 15.81 | 15.81 |
| Inventories | 22,045.2 | 28,471.9 | 35,904.5 | 35,517.8 | 35,606.6 | 36,653.9 | 39,222.9 | 41,972.0 | 44,913.7 | 48,061.6 |
| Inventories, % | 13.53 | 14.8 | 17.27 | 19.94 | 17.2 | 16.55 | 16.55 | 16.55 | 16.55 | 16.55 |
| Accounts Payable | 6,700.4 | 9,255.7 | 7,323.4 | 7,787.9 | 8,510.5 | 9,271.9 | 9,921.7 | 10,617.1 | 11,361.2 | 12,157.5 |
| Accounts Payable, % | 4.11 | 4.81 | 3.52 | 4.37 | 4.11 | 4.19 | 4.19 | 4.19 | 4.19 | 4.19 |
| Capital Expenditure | -27,706.4 | -34,281.6 | -36,550.4 | -41,646.6 | -35,366.8 | -41,141.7 | -44,025.2 | -47,110.8 | -50,412.7 | -53,946.0 |
| Capital Expenditure, % | -17.01 | -17.82 | -17.58 | -23.38 | -17.09 | -18.57 | -18.57 | -18.57 | -18.57 | -18.57 |
| Tax Rate, % | 10.41 | 10.41 | 10.41 | 10.41 | 10.41 | 10.41 | 10.41 | 10.41 | 10.41 | 10.41 |
| EBITAT | 17,987.9 | 26,848.3 | 37,387.8 | 9,996.1 | 23,225.2 | 25,588.8 | 27,382.3 | 29,301.5 | 31,355.1 | 33,552.7 |
| Depreciation | ||||||||||
| Changes in Account Receivables | ||||||||||
| Changes in Inventories | ||||||||||
| Changes in Accounts Payable | ||||||||||
| Capital Expenditure | ||||||||||
| UFCF | -27,976.2 | 4,936.1 | 20,675.7 | -5,167.3 | 10,965.6 | 15,507.1 | 10,793.3 | 11,549.7 | 12,359.2 | 13,225.5 |
| WACC, % | 5.96 | 5.99 | 6.51 | 6.51 | 6.31 | 6.25 | 6.25 | 6.25 | 6.25 | 6.25 |
| PV UFCF | ||||||||||
| SUM PV UFCF | 53,243.8 | |||||||||
| Long Term Growth Rate, % | 2.00 | |||||||||
| Free cash flow (T + 1) | 13,490 | |||||||||
| Terminal Value | 317,091 | |||||||||
| Present Terminal Value | 234,127 | |||||||||
| Enterprise Value | 287,371 | |||||||||
| Net Debt | -23,650 | |||||||||
| Equity Value | 311,021 | |||||||||
| Diluted Shares Outstanding, MM | 11 | |||||||||
| Equity Value Per Share | 28,619.31 |
What You Will Receive
- Customizable Excel Template: A fully adjustable Excel-based DCF Calculator featuring pre-filled real Samsung Electronics Co., Ltd. (BC94L) financial data.
- Accurate Financial Data: Historical figures and forward-looking projections (highlighted in the yellow cells).
- Flexible Forecasting: Modify forecast assumptions such as revenue growth, EBITDA margin, and WACC.
- Instant Calculations: Quickly observe how your inputs affect the valuation of Samsung Electronics Co., Ltd. (BC94L).
- Professional Resource: Designed for investors, CFOs, consultants, and financial analysts.
- Easy-to-Use Layout: Organized for clarity and user-friendliness, complete with step-by-step guidance.
Key Features
- Customizable Forecast Inputs: Adjust essential parameters such as revenue growth, EBITDA %, and capital expenditures.
- Instant DCF Valuation: Automatically computes intrinsic value, NPV, and other metrics with ease.
- High-Precision Accuracy: Leverages Samsung's real-world financial data to deliver realistic valuation results.
- Simplified Scenario Analysis: Evaluate various assumptions and effortlessly compare results.
- Efficiency-Boosting Tool: Remove the hassle of constructing complex valuation models from the ground up.
How It Works
- Step 1: Download the prebuilt Excel template containing Samsung Electronics Co., Ltd.'s data.
- Step 2: Navigate through the pre-filled sheets to familiarize yourself with the key metrics.
- Step 3: Modify the forecasts and assumptions in the editable yellow cells (WACC, growth, margins).
- Step 4: Instantly see the recalibrated results, including Samsung's intrinsic value.
- Step 5: Use the outputs to make informed investment decisions or to create detailed reports.
Why Choose This Calculator for Samsung Electronics Co., Ltd. (BC94L)?
- User-Friendly Interface: Perfect for both novices and seasoned professionals.
- Customizable Inputs: Easily adjust parameters to suit your analytical needs.
- Real-Time Valuation Updates: Witness immediate changes in Samsung’s valuation as you tweak inputs.
- Pre-Loaded Data: Comes equipped with Samsung’s actual financial figures for swift evaluations.
- Relied Upon by Experts: Trusted tool for investors and analysts to guide their decisions.
Who Should Consider This Product?
- Investors: Assess the fair value of Samsung Electronics Co., Ltd. (BC94L) with precision before making investment choices.
- CFOs: Utilize a high-quality DCF model for comprehensive financial reporting and analysis.
- Consultants: Efficiently customize the template for client valuation reports.
- Entrepreneurs: Discover insights into the financial modeling practices of leading global corporations.
- Educators: Employ it as an educational resource to illustrate various valuation techniques.
Contents of the Template
- Comprehensive DCF Model: Editable template featuring in-depth valuation calculations.
- Real-World Data: Samsung Electronics Co., Ltd. (BC94L) historical and projected financials preloaded for analysis.
- Customizable Parameters: Modify WACC, growth rates, and tax assumptions to explore different scenarios.
- Financial Statements: Detailed annual and quarterly breakdowns for enhanced insights.
- Key Ratios: Integrated analysis for profitability, efficiency, and leverage metrics.
- Dashboard with Visual Outputs: Charts and tables providing clear, actionable insights.
Disclaimer
All information, articles, and product details provided on this website are for general informational and educational purposes only. We do not claim any ownership over, nor do we intend to infringe upon, any trademarks, copyrights, logos, brand names, or other intellectual property mentioned or depicted on this site. Such intellectual property remains the property of its respective owners, and any references here are made solely for identification or informational purposes, without implying any affiliation, endorsement, or partnership.
We make no representations or warranties, express or implied, regarding the accuracy, completeness, or suitability of any content or products presented. Nothing on this website should be construed as legal, tax, investment, financial, medical, or other professional advice. In addition, no part of this site—including articles or product references—constitutes a solicitation, recommendation, endorsement, advertisement, or offer to buy or sell any securities, franchises, or other financial instruments, particularly in jurisdictions where such activity would be unlawful.
All content is of a general nature and may not address the specific circumstances of any individual or entity. It is not a substitute for professional advice or services. Any actions you take based on the information provided here are strictly at your own risk. You accept full responsibility for any decisions or outcomes arising from your use of this website and agree to release us from any liability in connection with your use of, or reliance upon, the content or products found herein.