
|
Valoración DCF de BCB Bancorp, Inc. (BCBP) |
Completamente Editable: Adáptelo A Sus Necesidades En Excel O Sheets
Diseño Profesional: Plantillas Confiables Y Estándares De La Industria
Predeterminadas Para Un Uso Rápido Y Eficiente
Compatible con MAC / PC, completamente desbloqueado
No Se Necesita Experiencia; Fáciles De Seguir
BCB Bancorp, Inc. (BCBP) Bundle
¡Simplifique la valoración de BCB Bancorp, Inc. (BCBP) con esta calculadora DCF personalizable! Con el Real BCB Bancorp, Inc. (BCBP) finanzas y entradas de pronóstico ajustable, puede probar escenarios y descubrir el valor razonable de BCB Bancorp, Inc. (BCBP) en minutos.
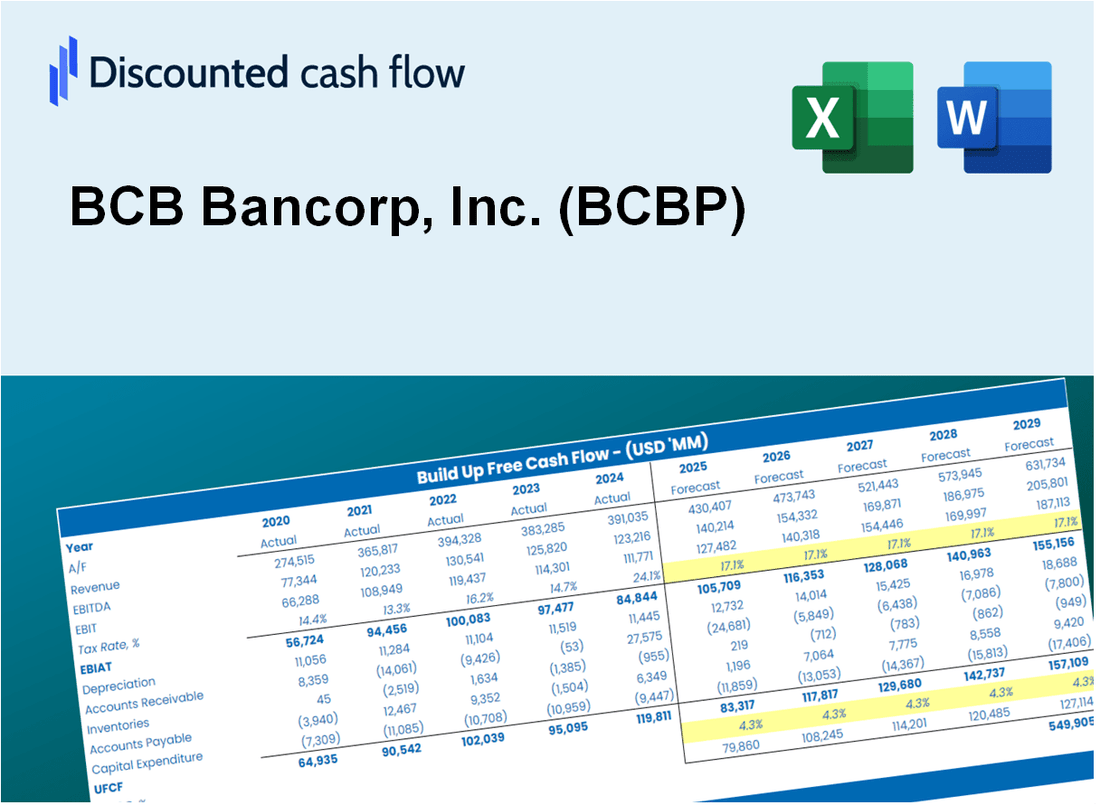
Discounted Cash Flow (DCF) - (USD MM)
| Year | AY1 2020 |
AY2 2021 |
AY3 2022 |
AY4 2023 |
AY5 2024 |
FY1 2025 |
FY2 2026 |
FY3 2027 |
FY4 2028 |
FY5 2029 |
|---|---|---|---|---|---|---|---|---|---|---|
| Revenue | 121.5 | 120.9 | 133.0 | 192.4 | 196.9 | 224.8 | 256.5 | 292.8 | 334.1 | 381.3 |
| Revenue Growth, % | 0 | -0.52741 | 10.04 | 44.66 | 2.34 | 14.13 | 14.13 | 14.13 | 14.13 | 14.13 |
| EBITDA | 30.0 | 50.5 | 63.7 | 40.9 | 26.5 | 67.0 | 76.5 | 87.3 | 99.6 | 113.7 |
| EBITDA, % | 24.67 | 41.75 | 47.92 | 21.25 | 13.46 | 29.81 | 29.81 | 29.81 | 29.81 | 29.81 |
| Depreciation | .4 | 2.2 | .6 | -.6 | .2 | 1.1 | 1.3 | 1.5 | 1.7 | 1.9 |
| Depreciation, % | 0.36367 | 1.84 | 0.48032 | -0.28839 | 0.12643 | 0.50399 | 0.50399 | 0.50399 | 0.50399 | 0.50399 |
| EBIT | 29.5 | 48.3 | 63.1 | 41.5 | 26.3 | 65.9 | 75.2 | 85.8 | 97.9 | 111.8 |
| EBIT, % | 24.31 | 39.92 | 47.44 | 21.54 | 13.34 | 29.31 | 29.31 | 29.31 | 29.31 | 29.31 |
| Total Cash | 361.7 | 497.6 | 321.8 | 279.5 | 318.0 | 224.8 | 256.5 | 292.8 | 334.1 | 381.3 |
| Total Cash, percent | .0 | .0 | .0 | .0 | .0 | .0 | .0 | .0 | .0 | .0 |
| Account Receivables | 12.9 | 9.2 | 13.5 | 16.1 | 15.2 | 20.0 | 22.8 | 26.0 | 29.7 | 33.9 |
| Account Receivables, % | 10.63 | 7.6 | 10.11 | 8.35 | 7.71 | 8.88 | 8.88 | 8.88 | 8.88 | 8.88 |
| Inventories | .0 | .0 | .0 | .0 | .0 | .0 | .0 | .0 | .0 | .0 |
| Inventories, % | 0 | 0 | 0 | 0 | 0 | 0 | 0 | 0 | 0 | 0 |
| Accounts Payable | .0 | .0 | .0 | .0 | .0 | .0 | .0 | .0 | .0 | .0 |
| Accounts Payable, % | 0 | 0 | 0 | 0 | 0 | 0 | 0 | 0 | 0 | 0 |
| Capital Expenditure | -1.4 | -.3 | -.5 | -4.5 | -1.2 | -2.1 | -2.4 | -2.8 | -3.2 | -3.6 |
| Capital Expenditure, % | -1.14 | -0.26882 | -0.38937 | -2.35 | -0.62199 | -0.95491 | -0.95491 | -0.95491 | -0.95491 | -0.95491 |
| Tax Rate, % | 29.11 | 29.11 | 29.11 | 29.11 | 29.11 | 29.11 | 29.11 | 29.11 | 29.11 | 29.11 |
| EBITAT | 20.9 | 34.2 | 45.6 | 29.5 | 18.6 | 46.9 | 53.5 | 61.1 | 69.7 | 79.6 |
| Depreciation | ||||||||||
| Changes in Account Receivables | ||||||||||
| Changes in Inventories | ||||||||||
| Changes in Accounts Payable | ||||||||||
| Capital Expenditure | ||||||||||
| UFCF | 7.1 | 39.9 | 41.4 | 21.8 | 18.5 | 41.1 | 49.6 | 56.6 | 64.6 | 73.7 |
| WACC, % | 12.74 | 12.75 | 12.95 | 12.77 | 12.74 | 12.79 | 12.79 | 12.79 | 12.79 | 12.79 |
| PV UFCF | ||||||||||
| SUM PV UFCF | 195.1 | |||||||||
| Long Term Growth Rate, % | 2.00 | |||||||||
| Free cash flow (T + 1) | 75 | |||||||||
| Terminal Value | 697 | |||||||||
| Present Terminal Value | 382 | |||||||||
| Enterprise Value | 577 | |||||||||
| Net Debt | 193 | |||||||||
| Equity Value | 383 | |||||||||
| Diluted Shares Outstanding, MM | 17 | |||||||||
| Equity Value Per Share | 22.53 |
What You Will Get
- Editable Forecast Inputs: Easily modify key assumptions (growth %, margins, WACC) to generate various scenarios.
- Real-World Data: BCB Bancorp, Inc.'s financial data pre-filled to kickstart your analysis.
- Automatic DCF Outputs: The template computes Net Present Value (NPV) and intrinsic value automatically for you.
- Customizable and Professional: A refined Excel model that adjusts to your valuation requirements.
- Built for Analysts and Investors: Perfect for evaluating projections, confirming strategies, and enhancing efficiency.
Key Features
- Comprehensive Financial Data: BCB Bancorp's historical financial statements and pre-filled projections.
- Customizable Parameters: Adjust WACC, tax rates, revenue growth, and EBITDA margins as needed.
- Real-Time Valuation: Observe BCB Bancorp’s intrinsic value update instantly.
- Intuitive Visualizations: Dashboard graphs illustrate valuation outcomes and essential metrics.
- Engineered for Precision: A reliable resource for analysts, investors, and finance professionals.
How It Works
- Download the Template: Gain immediate access to the Excel-based BCB Bancorp DCF Calculator.
- Input Your Assumptions: Modify the yellow-highlighted cells for growth rates, WACC, margins, and additional parameters.
- Instant Calculations: The model automatically recalculates BCB Bancorp's intrinsic value.
- Test Scenarios: Experiment with various assumptions to assess potential changes in valuation.
- Analyze and Decide: Utilize the findings to inform your investment or financial analysis.
Why Choose This Calculator for BCB Bancorp, Inc. (BCBP)?
- Accurate Data: Utilize real BCB Bancorp financials for dependable valuation outcomes.
- Customizable: Tailor essential parameters such as growth rates, WACC, and tax rates to align with your forecasts.
- Time-Saving: Pre-configured calculations save you from starting from the ground up.
- Professional-Grade Tool: Crafted for investors, analysts, and financial consultants.
- User-Friendly: Easy-to-navigate design and clear, step-by-step guidance make it accessible for all users.
Who Should Use This Product?
- Investors: Accurately assess BCB Bancorp, Inc.’s (BCBP) fair value prior to making investment choices.
- CFOs: Utilize a professional-grade DCF model for comprehensive financial reporting and analysis.
- Consultants: Easily customize the template for valuation reports tailored to clients.
- Entrepreneurs: Discover insights into financial modeling practices employed by leading financial institutions.
- Educators: Apply it as a teaching resource to illustrate various valuation methodologies.
What the Template Contains
- Preloaded BCBP Data: Historical and projected financial data, including revenue, EBIT, and capital expenditures.
- DCF and WACC Models: Professional-grade sheets for calculating intrinsic value and Weighted Average Cost of Capital.
- Editable Inputs: Yellow-highlighted cells for adjusting revenue growth, tax rates, and discount rates.
- Financial Statements: Comprehensive annual and quarterly financials for deeper analysis.
- Key Ratios: Profitability, leverage, and efficiency ratios to evaluate performance.
- Dashboard and Charts: Visual summaries of valuation outcomes and assumptions.
Disclaimer
All information, articles, and product details provided on this website are for general informational and educational purposes only. We do not claim any ownership over, nor do we intend to infringe upon, any trademarks, copyrights, logos, brand names, or other intellectual property mentioned or depicted on this site. Such intellectual property remains the property of its respective owners, and any references here are made solely for identification or informational purposes, without implying any affiliation, endorsement, or partnership.
We make no representations or warranties, express or implied, regarding the accuracy, completeness, or suitability of any content or products presented. Nothing on this website should be construed as legal, tax, investment, financial, medical, or other professional advice. In addition, no part of this site—including articles or product references—constitutes a solicitation, recommendation, endorsement, advertisement, or offer to buy or sell any securities, franchises, or other financial instruments, particularly in jurisdictions where such activity would be unlawful.
All content is of a general nature and may not address the specific circumstances of any individual or entity. It is not a substitute for professional advice or services. Any actions you take based on the information provided here are strictly at your own risk. You accept full responsibility for any decisions or outcomes arising from your use of this website and agree to release us from any liability in connection with your use of, or reliance upon, the content or products found herein.