
|
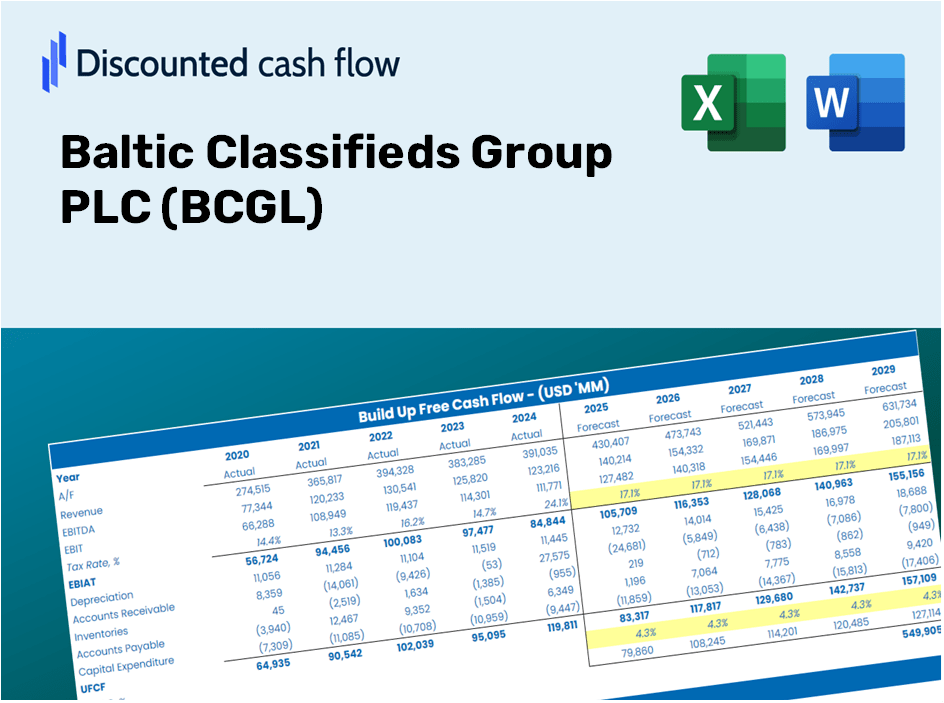
Valoración de DCF del grupo Baltic Classifieds PLC (BCG.L) |
Completamente Editable: Adáptelo A Sus Necesidades En Excel O Sheets
Diseño Profesional: Plantillas Confiables Y Estándares De La Industria
Predeterminadas Para Un Uso Rápido Y Eficiente
Compatible con MAC / PC, completamente desbloqueado
No Se Necesita Experiencia; Fáciles De Seguir
Baltic Classifieds Group PLC (BCG.L) Bundle
¡Desbloquee el potencial financiero de Baltic Classifieds Group PLC (BCGL) con nuestra calculadora DCF fácil de usar! Ingrese sus proyecciones para el crecimiento, los márgenes de beneficio y los gastos para calcular el valor intrínseco del grupo Baltic Classifieds PLC (BCGL) y refinar su estrategia de inversión.
Discounted Cash Flow (DCF) - (USD MM)
| Year | AY1 2020 |
AY2 2021 |
AY3 2022 |
AY4 2023 |
AY5 2024 |
FY1 2025 |
FY2 2026 |
FY3 2027 |
FY4 2028 |
FY5 2029 |
|---|---|---|---|---|---|---|---|---|---|---|
| Revenue | 36.9 | 44.5 | 53.1 | 63.0 | 72.4 | 85.6 | 101.3 | 119.9 | 141.9 | 167.9 |
| Revenue Growth, % | 0 | 20.56 | 19.34 | 18.5 | 14.91 | 18.33 | 18.33 | 18.33 | 18.33 | 18.33 |
| EBITDA | 28.1 | 25.2 | 40.0 | 48.0 | 56.4 | 62.0 | 73.4 | 86.8 | 102.7 | 121.5 |
| EBITDA, % | 76.1 | 56.48 | 75.2 | 76.22 | 77.96 | 72.39 | 72.39 | 72.39 | 72.39 | 72.39 |
| Depreciation | 14.8 | 14.8 | 14.8 | 14.5 | 9.5 | 23.5 | 27.8 | 32.9 | 39.0 | 46.1 |
| Depreciation, % | 40.14 | 33.15 | 27.94 | 23.02 | 13.15 | 27.48 | 27.48 | 27.48 | 27.48 | 27.48 |
| EBIT | 13.3 | 10.4 | 25.1 | 33.5 | 46.9 | 38.5 | 45.5 | 53.9 | 63.7 | 75.4 |
| EBIT, % | 35.96 | 23.33 | 47.27 | 53.2 | 64.81 | 44.91 | 44.91 | 44.91 | 44.91 | 44.91 |
| Total Cash | 15.0 | 17.4 | 23.7 | 21.7 | 20.6 | 32.0 | 37.9 | 44.9 | 53.1 | 62.8 |
| Total Cash, percent | .0 | .0 | .0 | .0 | .0 | .0 | .0 | .0 | .0 | .0 |
| Account Receivables | 2.1 | 2.6 | 2.9 | 3.7 | 3.9 | 4.8 | 5.7 | 6.8 | 8.0 | 9.5 |
| Account Receivables, % | 5.77 | 5.75 | 5.39 | 5.89 | 5.43 | 5.65 | 5.65 | 5.65 | 5.65 | 5.65 |
| Inventories | .5 | .0 | .0 | .0 | .0 | .2 | .3 | .3 | .4 | .5 |
| Inventories, % | 1.44 | 0 | 0 | 0 | 0 | 0.28769 | 0.28769 | 0.28769 | 0.28769 | 0.28769 |
| Accounts Payable | .3 | .2 | .3 | .3 | .4 | .5 | .6 | .7 | .8 | .9 |
| Accounts Payable, % | 0.76181 | 0.46116 | 0.49166 | 0.55365 | 0.49269 | 0.55219 | 0.55219 | 0.55219 | 0.55219 | 0.55219 |
| Capital Expenditure | -.1 | -.4 | -.2 | -.3 | -.3 | -.4 | -.5 | -.6 | -.7 | -.8 |
| Capital Expenditure, % | -0.18454 | -0.8497 | -0.41273 | -0.4246 | -0.42627 | -0.45957 | -0.45957 | -0.45957 | -0.45957 | -0.45957 |
| Tax Rate, % | 12.41 | 12.41 | 12.41 | 12.41 | 12.41 | 12.41 | 12.41 | 12.41 | 12.41 | 12.41 |
| EBITAT | -.7 | 10.2 | 22.1 | 30.7 | 41.1 | 28.1 | 33.3 | 39.4 | 46.6 | 55.1 |
| Depreciation | ||||||||||
| Changes in Account Receivables | ||||||||||
| Changes in Inventories | ||||||||||
| Changes in Accounts Payable | ||||||||||
| Capital Expenditure | ||||||||||
| UFCF | 11.7 | 24.6 | 36.5 | 44.2 | 50.1 | 50.2 | 59.8 | 70.8 | 83.7 | 99.1 |
| WACC, % | 9.77 | 9.92 | 9.9 | 9.91 | 9.9 | 9.88 | 9.88 | 9.88 | 9.88 | 9.88 |
| PV UFCF | ||||||||||
| SUM PV UFCF | 267.9 | |||||||||
| Long Term Growth Rate, % | 4.00 | |||||||||
| Free cash flow (T + 1) | 103 | |||||||||
| Terminal Value | 1,752 | |||||||||
| Present Terminal Value | 1,094 | |||||||||
| Enterprise Value | 1,362 | |||||||||
| Net Debt | 2 | |||||||||
| Equity Value | 1,360 | |||||||||
| Diluted Shares Outstanding, MM | 483 | |||||||||
| Equity Value Per Share | 281.48 |
What You Will Receive
- Authentic BCGL Data: Preloaded financial metrics – encompassing revenue through EBIT – derived from real and projected figures.
- Complete Customization: Modify all essential parameters (yellow cells) including WACC, growth percentages, and tax rates.
- Immediate Valuation Adjustments: Automatic recalculations to assess the effect of changes on BCGL’s fair value.
- Flexible Excel Template: Designed for easy edits, scenario analysis, and in-depth projections.
- Efficient and Precise: Avoid the hassle of building models from the ground up while ensuring accuracy and adaptability.
Key Features
- Accurate Baltic Classifieds Group Data: Access reliable pre-loaded historical figures and future forecasts.
- Adjustable Assumptions for Forecasting: Modify the yellow-highlighted cells, including WACC, growth rates, and margins.
- Real-Time Calculations: Automatic updates for DCF, Net Present Value (NPV), and cash flow assessments.
- User-Friendly Dashboard: Clear and informative charts and summaries for visualizing your valuation results.
- Designed for All Skill Levels: An intuitive layout tailored for investors, CFOs, and consultants alike.
How It Operates
- 1. Access the Template: Download and open the Excel file that contains Baltic Classifieds Group PLC (BCGL)'s pre-loaded data.
- 2. Modify Assumptions: Adjust critical inputs such as growth rates, WACC, and capital expenditures.
- 3. Instant Results: The DCF model automatically computes intrinsic value and NPV in real time.
- 4. Explore Scenarios: Evaluate various forecasts to investigate different valuation possibilities.
- 5. Present with Assurance: Showcase professional valuation insights to bolster your decision-making process.
Why Opt for the BCGL Calculator?
- Precision: Utilizes authentic Baltic Classifieds Group PLC financials for reliable data.
- Versatility: Crafted to allow users to experiment with and adjust inputs effortlessly.
- Efficiency: Eliminate the need to construct a DCF model from the ground up.
- Expert-Level: Engineered with the accuracy and functionality expected by CFOs.
- Intuitive: Straightforward to navigate, even for those new to financial modeling.
Who Can Benefit from BCGL?
- Investors: Empower your investment choices with a high-quality valuation tool from Baltic Classifieds Group PLC (BCGL).
- Financial Analysts: Streamline your workflow with a customizable DCF model that’s ready to use.
- Consultants: Easily modify the template for impactful client presentations and reports.
- Finance Enthusiasts: Enhance your grasp of valuation methods through real-life examples provided by BCGL.
- Educators and Students: Utilize this resource as a hands-on learning tool in finance courses.
Contents of the Template
- Detailed DCF Model: Editable template featuring extensive valuation calculations.
- Market Data: Preloaded historical and projected financials for Baltic Classifieds Group PLC (BCGL) for thorough analysis.
- Flexible Parameters: Modify WACC, growth rates, and tax assumptions to explore various scenarios.
- Financial Statements: Complete annual and quarterly statements for enhanced insights.
- Key Financial Ratios: Integrated analysis for assessing profitability, efficiency, and leverage.
- Interactive Dashboard: Visual outputs such as charts and tables for concise, actionable insights.
Disclaimer
All information, articles, and product details provided on this website are for general informational and educational purposes only. We do not claim any ownership over, nor do we intend to infringe upon, any trademarks, copyrights, logos, brand names, or other intellectual property mentioned or depicted on this site. Such intellectual property remains the property of its respective owners, and any references here are made solely for identification or informational purposes, without implying any affiliation, endorsement, or partnership.
We make no representations or warranties, express or implied, regarding the accuracy, completeness, or suitability of any content or products presented. Nothing on this website should be construed as legal, tax, investment, financial, medical, or other professional advice. In addition, no part of this site—including articles or product references—constitutes a solicitation, recommendation, endorsement, advertisement, or offer to buy or sell any securities, franchises, or other financial instruments, particularly in jurisdictions where such activity would be unlawful.
All content is of a general nature and may not address the specific circumstances of any individual or entity. It is not a substitute for professional advice or services. Any actions you take based on the information provided here are strictly at your own risk. You accept full responsibility for any decisions or outcomes arising from your use of this website and agree to release us from any liability in connection with your use of, or reliance upon, the content or products found herein.