
|
Flanigan's Enterprises, Inc. (BDL) DCF Valuation |
Completamente Editable: Adáptelo A Sus Necesidades En Excel O Sheets
Diseño Profesional: Plantillas Confiables Y Estándares De La Industria
Predeterminadas Para Un Uso Rápido Y Eficiente
Compatible con MAC / PC, completamente desbloqueado
No Se Necesita Experiencia; Fáciles De Seguir
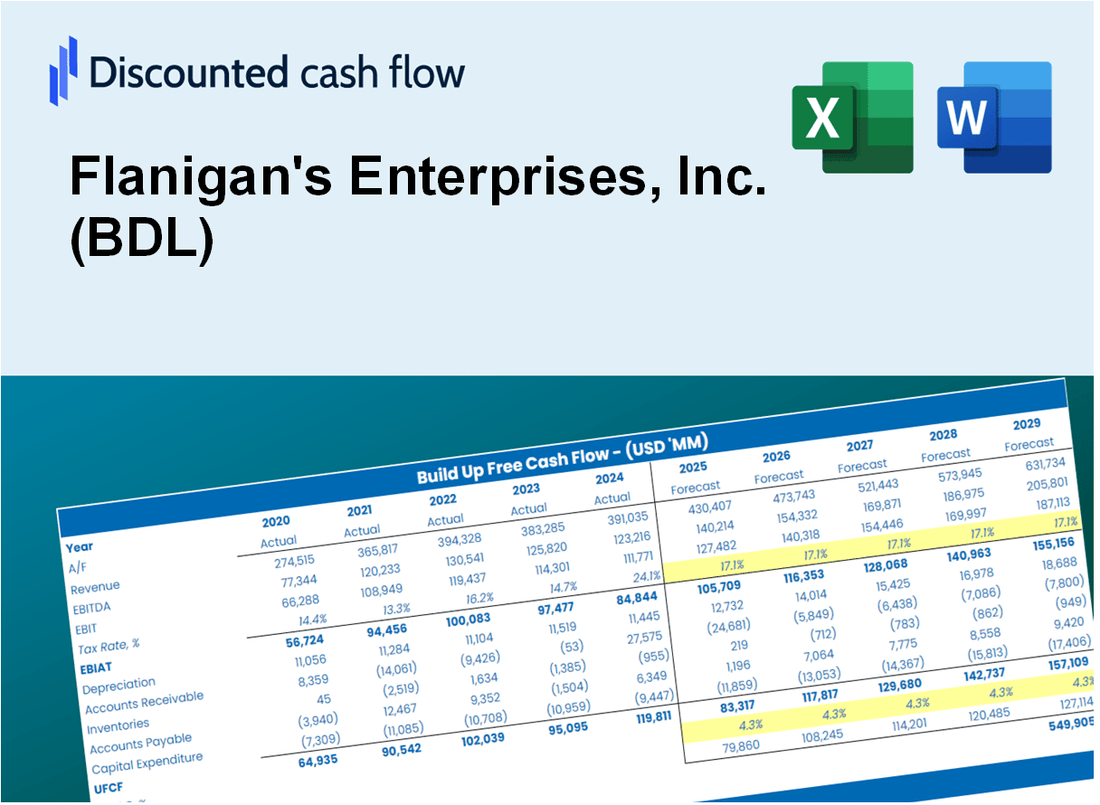
Flanigan's Enterprises, Inc. (BDL) Bundle
Explore the financial future of Flanigan's Enterprises, Inc. (BDL) with our user-friendly DCF Calculator! Enter your assumptions on growth, margins, and costs to calculate the intrinsic value of Flanigan's Enterprises, Inc. (BDL) and refine your investment strategy.
Discounted Cash Flow (DCF) - (USD MM)
| Year | AY1 2021 |
AY2 2022 |
AY3 2023 |
AY4 2024 |
AY5 2025 |
FY1 2026 |
FY2 2027 |
FY3 2028 |
FY4 2029 |
FY5 2030 |
|---|---|---|---|---|---|---|---|---|---|---|
| Revenue | 137.0 | 158.0 | 174.4 | 188.3 | 205.2 | 220.6 | 234.3 | 246.3 | 256.9 | 266.0 |
| Revenue Growth, % | 0 | 15.26 | 10.41 | 7.98 | 8.99 | 7.47 | 6.2 | 5.16 | 4.28 | 3.56 |
| EBITDA | 24.5 | 16.0 | 13.2 | 13.4 | 16.9 | 22.5 | 23.9 | 25.1 | 26.2 | 27.1 |
| EBITDA, % | 17.87 | 10.11 | 7.6 | 7.14 | 8.26 | 10.19 | 10.19 | 10.19 | 10.19 | 10.19 |
| Depreciation | 5.6 | 5.4 | 6.1 | 6.8 | 7.3 | 8.0 | 8.5 | 9.0 | 9.4 | 9.7 |
| Depreciation, % | 4.09 | 3.42 | 3.51 | 3.63 | 3.58 | 3.65 | 3.65 | 3.65 | 3.65 | 3.65 |
| EBIT | 18.9 | 10.6 | 7.1 | 6.6 | 9.6 | 14.4 | 15.3 | 16.1 | 16.8 | 17.4 |
| EBIT, % | 13.78 | 6.69 | 4.09 | 3.51 | 4.68 | 6.55 | 6.55 | 6.55 | 6.55 | 6.55 |
| Total Cash | 32.7 | 42.1 | 25.5 | 21.4 | 20.1 | 38.1 | 40.4 | 42.5 | 44.3 | 45.9 |
| Total Cash, percent | .0 | .0 | .0 | .0 | .0 | .0 | .0 | .0 | .0 | .0 |
| Account Receivables | .5 | .5 | .8 | 1.1 | .9 | 1.1 | 1.2 | 1.4 | 1.6 | 1.8 |
| Account Receivables, % | 0.32836 | 0.28868 | 0.47822 | 0.56446 | 0.4346 | 0.4834 | 0.53217 | 0.58092 | 0.62965 | 0.67836 |
| Inventories | 4.3 | 6.5 | 7.2 | 7.0 | 6.9 | 7.5 | 7.9 | 8.4 | 8.8 | 9.1 |
| Inventories, % | 3.13 | 4.11 | 4.13 | 3.73 | 3.37 | 3.38 | 3.39 | 3.4 | 3.42 | 3.43 |
| Accounts Payable | 6.4 | 8.1 | 9.3 | 7.2 | 9.1 | 10.3 | 11.0 | 11.5 | 12.0 | 12.4 |
| Accounts Payable, % | 4.69 | 5.13 | 5.32 | 3.83 | 4.42 | 4.68 | 4.68 | 4.68 | 4.68 | 4.68 |
| Capital Expenditure | -11.3 | -9.6 | -18.7 | -5.2 | -5.8 | -13.5 | -14.4 | -15.1 | -15.7 | -16.3 |
| Capital Expenditure, % | -8.26 | -6.05 | -10.71 | -2.78 | -2.84 | -6.13 | -6.13 | -6.13 | -6.13 | -6.13 |
| Tax Rate, % | 41.74 | 41.74 | 41.74 | 41.74 | 41.74 | 41.74 | 41.74 | 41.74 | 41.74 | 41.74 |
| EBITAT | 12.4 | 6.8 | 4.7 | 4.0 | 5.6 | 9.1 | 9.6 | 10.1 | 10.6 | 11.0 |
| Depreciation | ||||||||||
| Changes in Account Receivables | ||||||||||
| Changes in Inventories | ||||||||||
| Changes in Accounts Payable | ||||||||||
| Capital Expenditure | ||||||||||
| UFCF | 8.4 | 2.1 | -7.8 | 3.5 | 9.2 | 4.1 | 3.8 | 4.0 | 4.1 | 4.2 |
| WACC, % | 5.29 | 5.27 | 5.29 | 5.2 | 5.17 | 5.24 | 5.24 | 5.24 | 5.24 | 5.24 |
| PV UFCF | ||||||||||
| SUM PV UFCF | 17.4 | |||||||||
| Long Term Growth Rate, % | 0.50 | |||||||||
| Free cash flow (T + 1) | 4 | |||||||||
| Terminal Value | 90 | |||||||||
| Present Terminal Value | 70 | |||||||||
| Enterprise Value | 87 | |||||||||
| Net Debt | 27 | |||||||||
| Equity Value | 60 | |||||||||
| Diluted Shares Outstanding, MM | 2 | |||||||||
| Equity Value Per Share | 32.29 |
What You Will Get
- Real BDL Financial Data: Pre-filled with Flanigan's Enterprises' historical and projected data for precise analysis.
- Fully Editable Template: Modify key inputs like revenue growth, WACC, and EBITDA % with ease.
- Automatic Calculations: See Flanigan's intrinsic value update instantly based on your changes.
- Professional Valuation Tool: Designed for investors, analysts, and consultants seeking accurate DCF results.
- User-Friendly Design: Simple structure and clear instructions for all experience levels.
Key Features
- 🔍 Real-Life BDL Financials: Pre-filled historical and projected data for Flanigan's Enterprises, Inc.
- ✏️ Fully Customizable Inputs: Adjust all critical parameters (yellow cells) like WACC, growth %, and tax rates.
- 📊 Professional DCF Valuation: Built-in formulas calculate Flanigan's intrinsic value using the Discounted Cash Flow method.
- ⚡ Instant Results: Visualize Flanigan's valuation instantly after making changes.
- Scenario Analysis: Test and compare outcomes for various financial assumptions side-by-side.
How It Works
- Download the Template: Gain immediate access to the Excel-based BDL Valuation Model.
- Input Your Assumptions: Modify the yellow-highlighted cells for growth rates, discount rates, profit margins, and more.
- Instant Calculations: The model automatically recalculates Flanigan's intrinsic value.
- Test Scenarios: Experiment with various assumptions to see how they affect the valuation.
- Analyze and Decide: Leverage the results to inform your investment or financial strategy.
Why Choose Flanigan's Enterprises, Inc. (BDL)?
- Save Time: Quickly access essential financial insights without extensive setup.
- Enhance Accuracy: Utilize dependable data and calculations to minimize valuation errors.
- Completely Customizable: Adjust the model to align with your specific forecasts and assumptions.
- User-Friendly: Intuitive charts and outputs facilitate straightforward analysis of results.
- Endorsed by Professionals: Crafted for experts who prioritize both precision and functionality.
Who Should Use Flanigan's Enterprises, Inc. (BDL)?
- Restaurant Investors: Develop comprehensive financial models to assess investment opportunities in the dining sector.
- Corporate Strategy Teams: Evaluate market trends to inform strategic decisions for Flanigan's Enterprises.
- Financial Consultants: Offer clients precise valuation assessments for Flanigan's Enterprises, Inc. (BDL).
- Students and Instructors: Utilize industry data to enhance learning in restaurant management and financial analysis.
- Culinary Enthusiasts: Gain insights into how restaurant chains like Flanigan's are valued within the industry.
What the Template Contains
- Pre-Filled DCF Model: Flanigan's financial data preloaded for immediate use.
- WACC Calculator: Detailed calculations for Weighted Average Cost of Capital.
- Financial Ratios: Evaluate Flanigan's profitability, leverage, and efficiency.
- Editable Inputs: Change assumptions such as growth, margins, and CAPEX to fit your scenarios.
- Financial Statements: Annual and quarterly reports to support detailed analysis.
- Interactive Dashboard: Easily visualize key valuation metrics and results.
Disclaimer
All information, articles, and product details provided on this website are for general informational and educational purposes only. We do not claim any ownership over, nor do we intend to infringe upon, any trademarks, copyrights, logos, brand names, or other intellectual property mentioned or depicted on this site. Such intellectual property remains the property of its respective owners, and any references here are made solely for identification or informational purposes, without implying any affiliation, endorsement, or partnership.
We make no representations or warranties, express or implied, regarding the accuracy, completeness, or suitability of any content or products presented. Nothing on this website should be construed as legal, tax, investment, financial, medical, or other professional advice. In addition, no part of this site—including articles or product references—constitutes a solicitation, recommendation, endorsement, advertisement, or offer to buy or sell any securities, franchises, or other financial instruments, particularly in jurisdictions where such activity would be unlawful.
All content is of a general nature and may not address the specific circumstances of any individual or entity. It is not a substitute for professional advice or services. Any actions you take based on the information provided here are strictly at your own risk. You accept full responsibility for any decisions or outcomes arising from your use of this website and agree to release us from any liability in connection with your use of, or reliance upon, the content or products found herein.